
The Armory
PX-09
Enterprise AI Layer
Fivetran + Snowflake + dbt + Looker, in one application
Tessera Class
ERP AI
An enterprise AI layer that sits on top of the ERP — ingestion, warehouse model, 229 governed metrics and eleven persona dashboards in one deployable application, reporting the contribution margin an ERP cannot produce.
Live
Category
Enterprise AI Layer
Status
Live
Version
v1.0
Class
Tessera Class
erp.par2labs.com
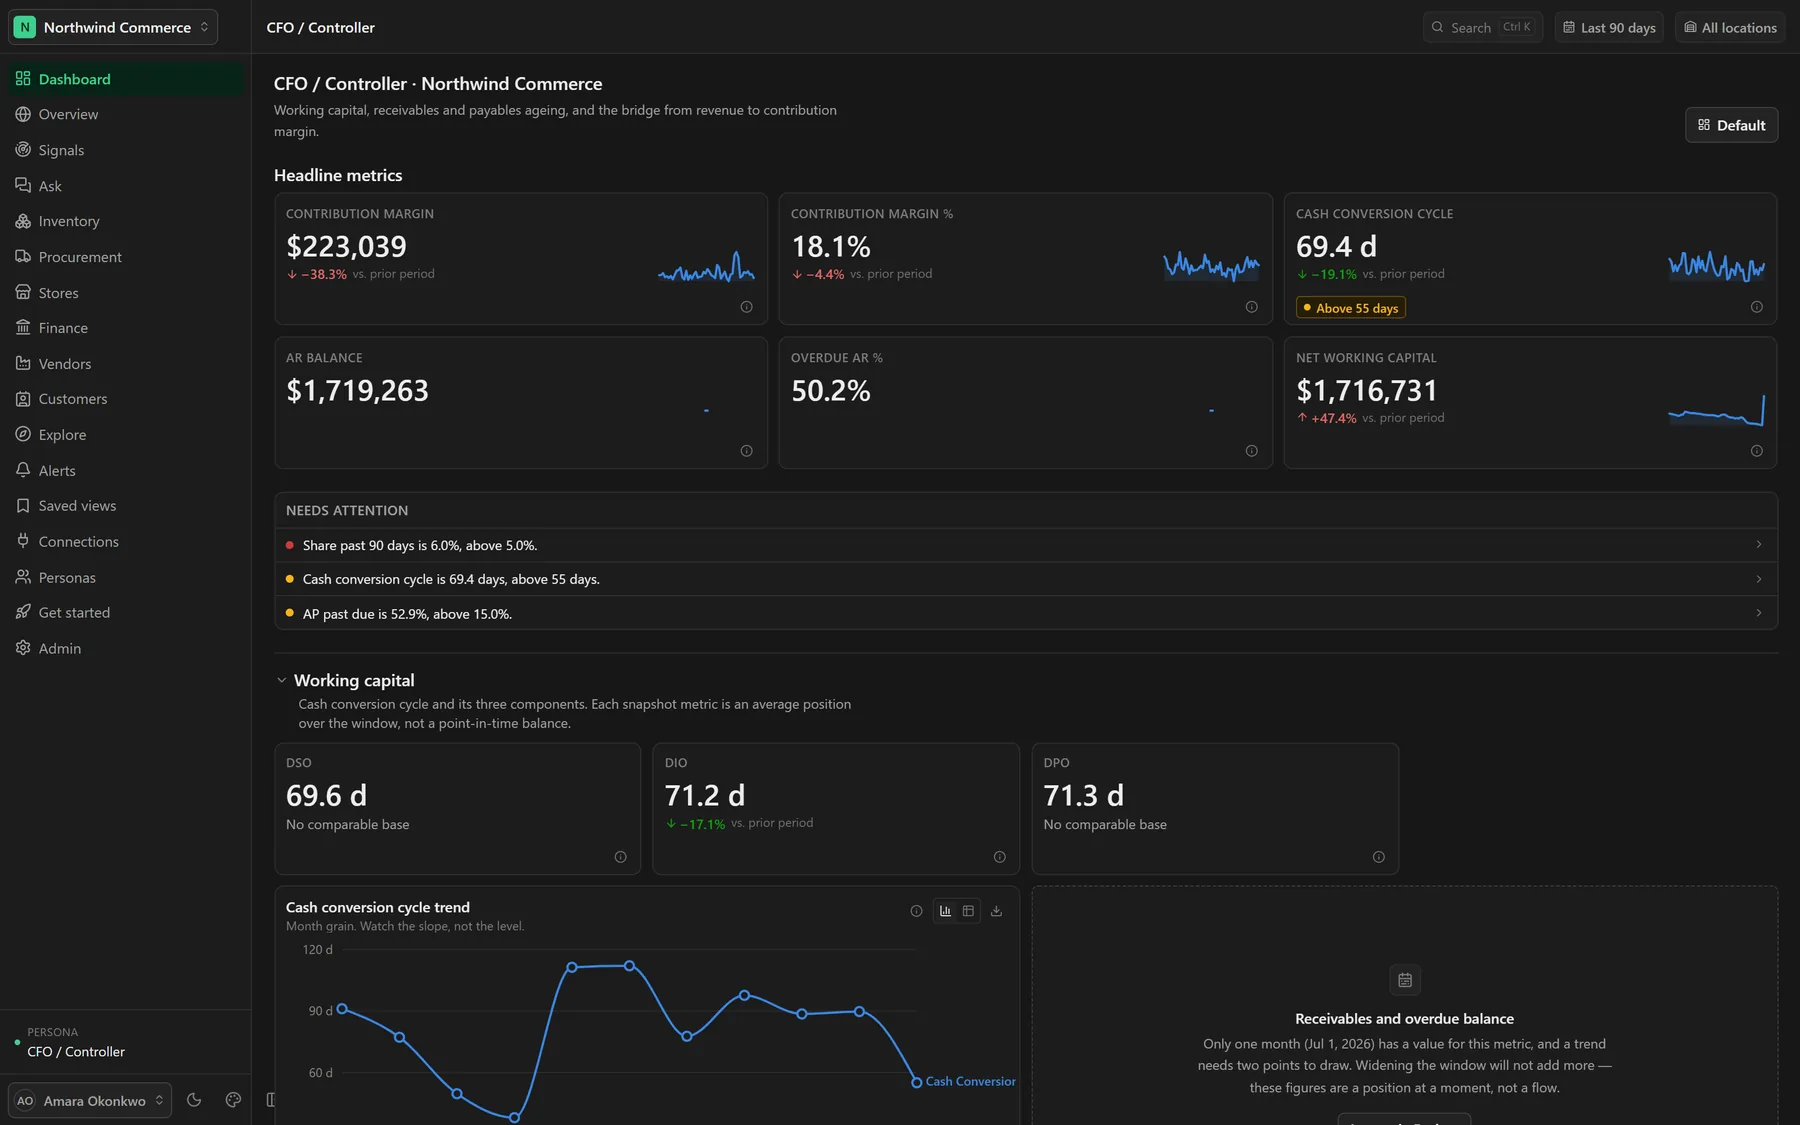
01 — Dashboard. The CFO / Controller persona on a seeded workspace: contribution margin, cash conversion cycle, working capital, and what needs attention. Captured from the running deployment.
Overview
Which orders actually make money?
ERP AI replaces the four-vendor analytics stack — extract-and-load, warehouse, modelling, BI — with one application a finance or operations lead can connect in an hour. It ingests from Dynamics 365 Finance & Operations, Business Central, NetSuite, Acumatica, Shopify, Amazon SP-API and CSV, models it into an ERP-agnostic star schema, and serves it through a governed catalog of 229 metrics and 101 dimensions. Every read path — a dashboard tile, an ad-hoc query, an alert, an export, the assistant — produces a validated query specification rather than SQL, so a metric has exactly one definition and a language model cannot invent a table or reach a row the caller could not already see. The wedge is a number your ERP does not have: it books revenue and product cost, but not outbound freight, payment processing, marketplace fees or the eventual cost of returns, which on a direct-to-consumer line routinely total 18–30% of net revenue. ERP AI decomposes all seven components on every order line and reports true contribution margin.
Multi-tenant isolation is enforced by Postgres row-level security rather than by application filters: the app connects as a role that is neither superuser nor BYPASSRLS, and a forgotten predicate returns zero rows rather than another workspace's books.
// Specifications
Deployment
erp.par2labs.com · self-host · Docker · K8s
ERP sources
Dynamics 365 F&O · Business Central · NetSuite · Acumatica
Channel sources
Shopify · Amazon SP-API · CSV / REST
Semantic layer
229 governed metrics · 101 dimensions · QuerySpec compiler
Dashboards
11 personas, rendered from declarative specs
Warehouse
Postgres star schema · 7-part landed cost as generated columns
Assistant
Plans a QuerySpec, never SQL · degrades without an API key
Analytics
Holt-Winters forecast · STL + robust z-score anomaly · log-log elasticity
Tenancy
Postgres row-level security · NOSUPERUSER, NOBYPASSRLS role
Access
Owner / admin / analyst / viewer + row-level data scope
Verification
4,214 tests across 54 files · RLS proven against a live database
Pricing
Priced on orders, not seats
The headline acts
Three things a BI tool on top of your ERP will not do.
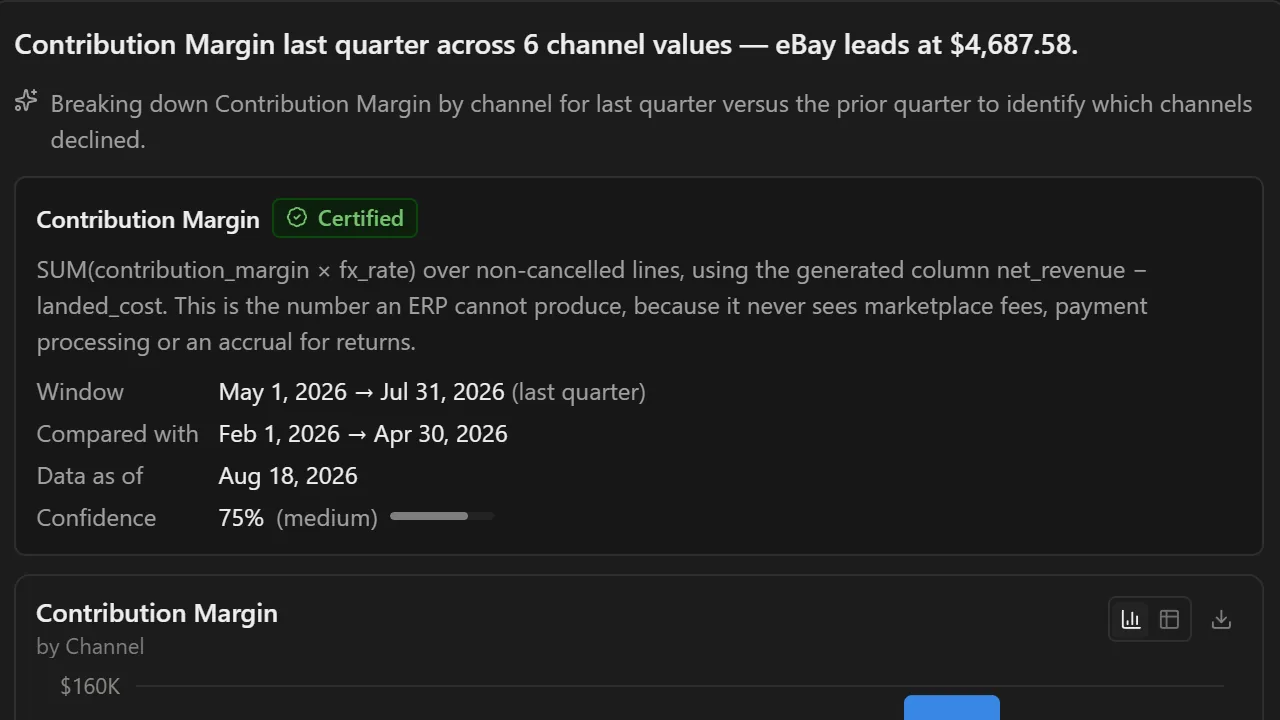
The number the ERP cannot produce
Margin after freight, fees and returns.
Your ERP books revenue and product cost, then stops. Outbound shipping, payment processing, marketplace commission, pick-and-pack and the eventual cost of a return are 18–30% of net revenue on a direct-to-consumer line, and none of them reach the margin figure you are managing to. ERP AI decomposes seven cost components on every order line, and landed cost and contribution margin are generated columns — computed by the database, so no query can derive them a second way.
7 cost components · generated columns · ties out to the GL
Ranked by what it is worth
Not a dashboard. A list of decisions.
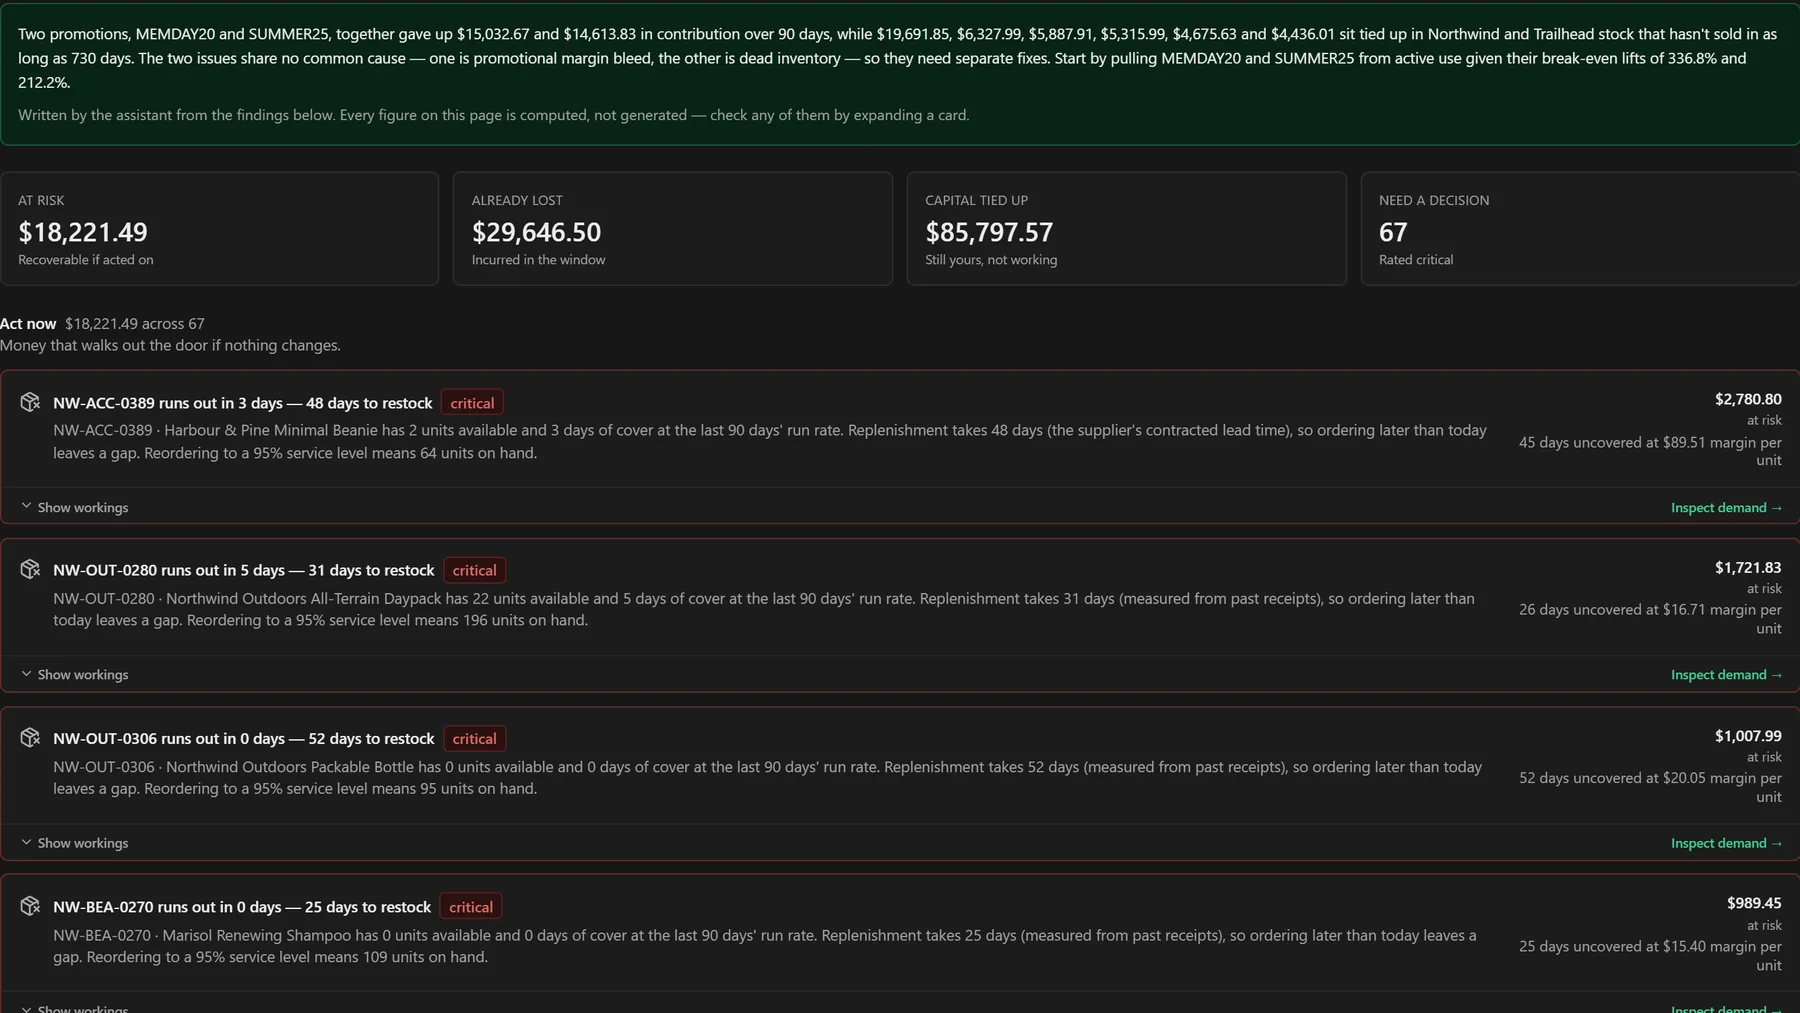
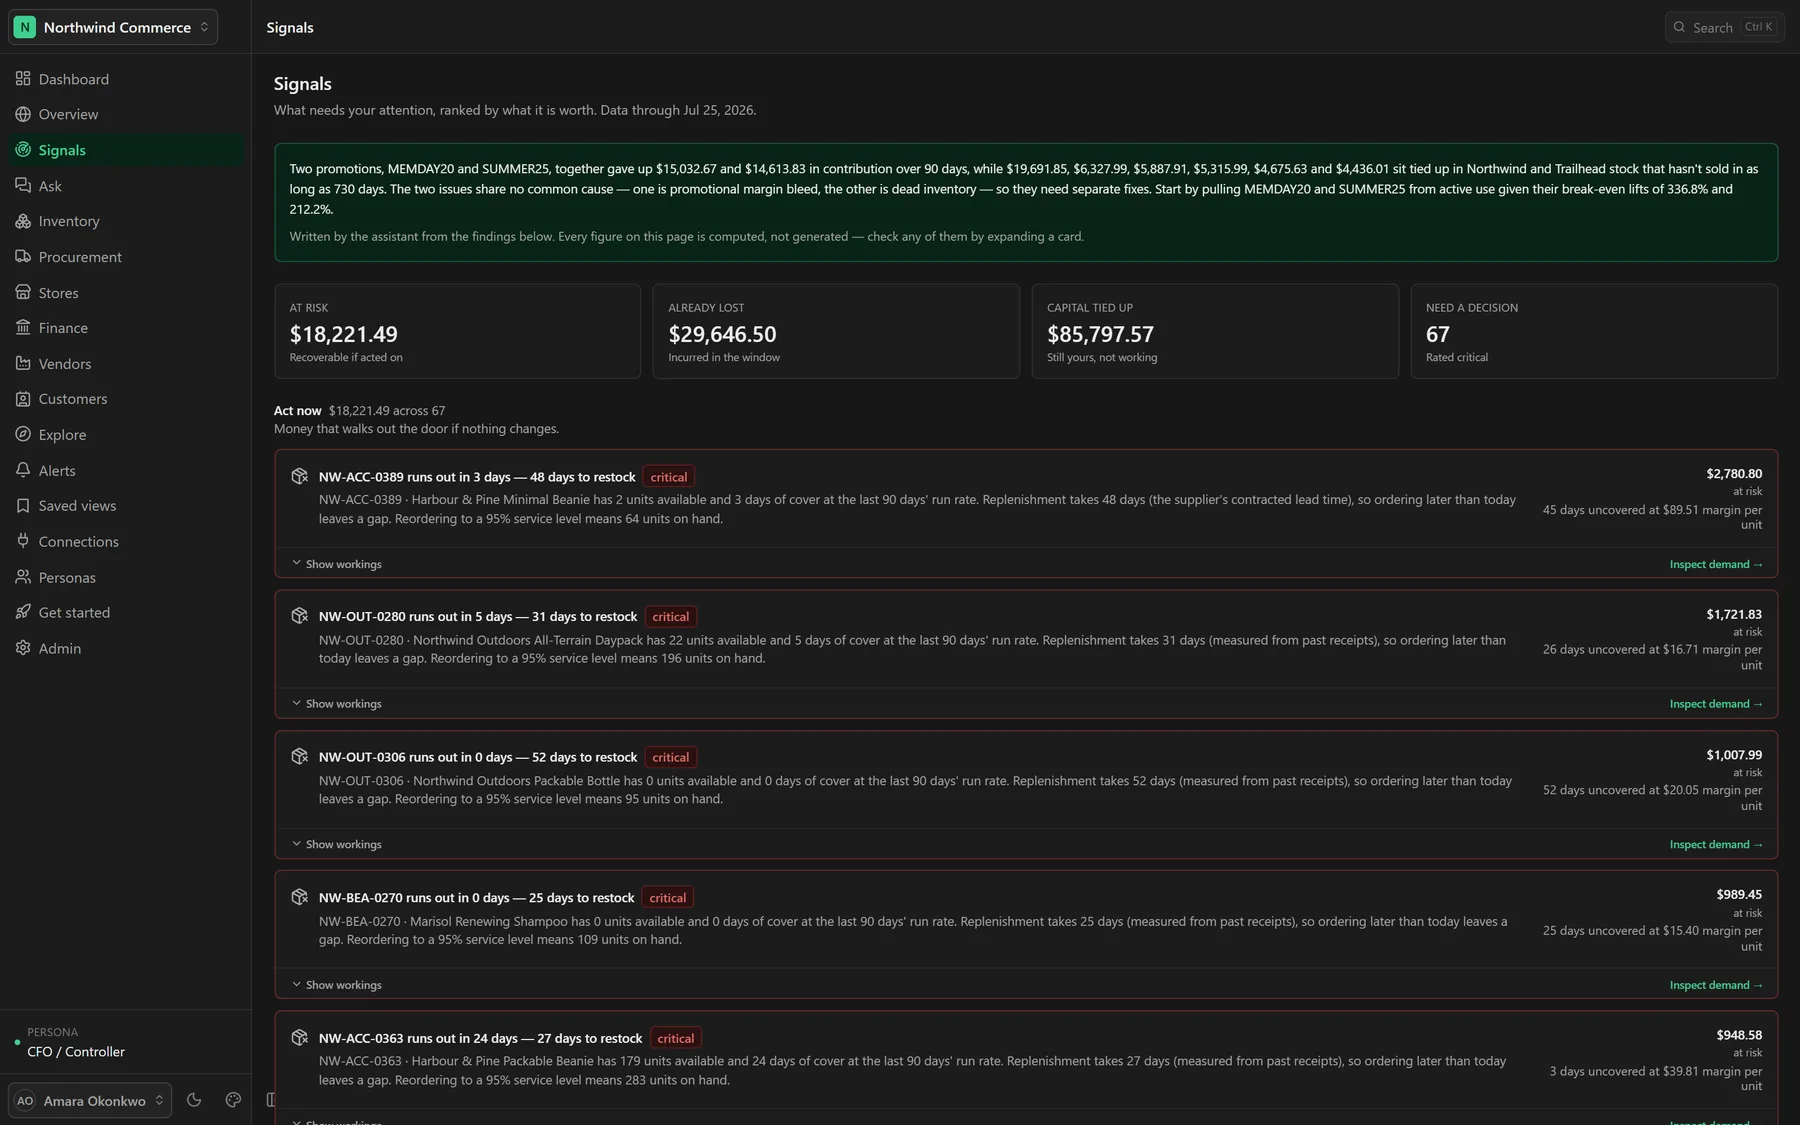
A dashboard answers how you are doing. Signals answers what to do about it — every finding priced, ranked, and stated as money at risk, money already lost, or capital tied up doing nothing. Each one opens to show its workings: the inputs, the counterfactual the number is measured against, and the arithmetic. Nothing on the page is generated prose over a chart; the figures are computed and the narrative is written from them.
stockout risk · dead stock · discount leakage · anomalies
The model never writes SQL
Ask in English. Get a governed number.
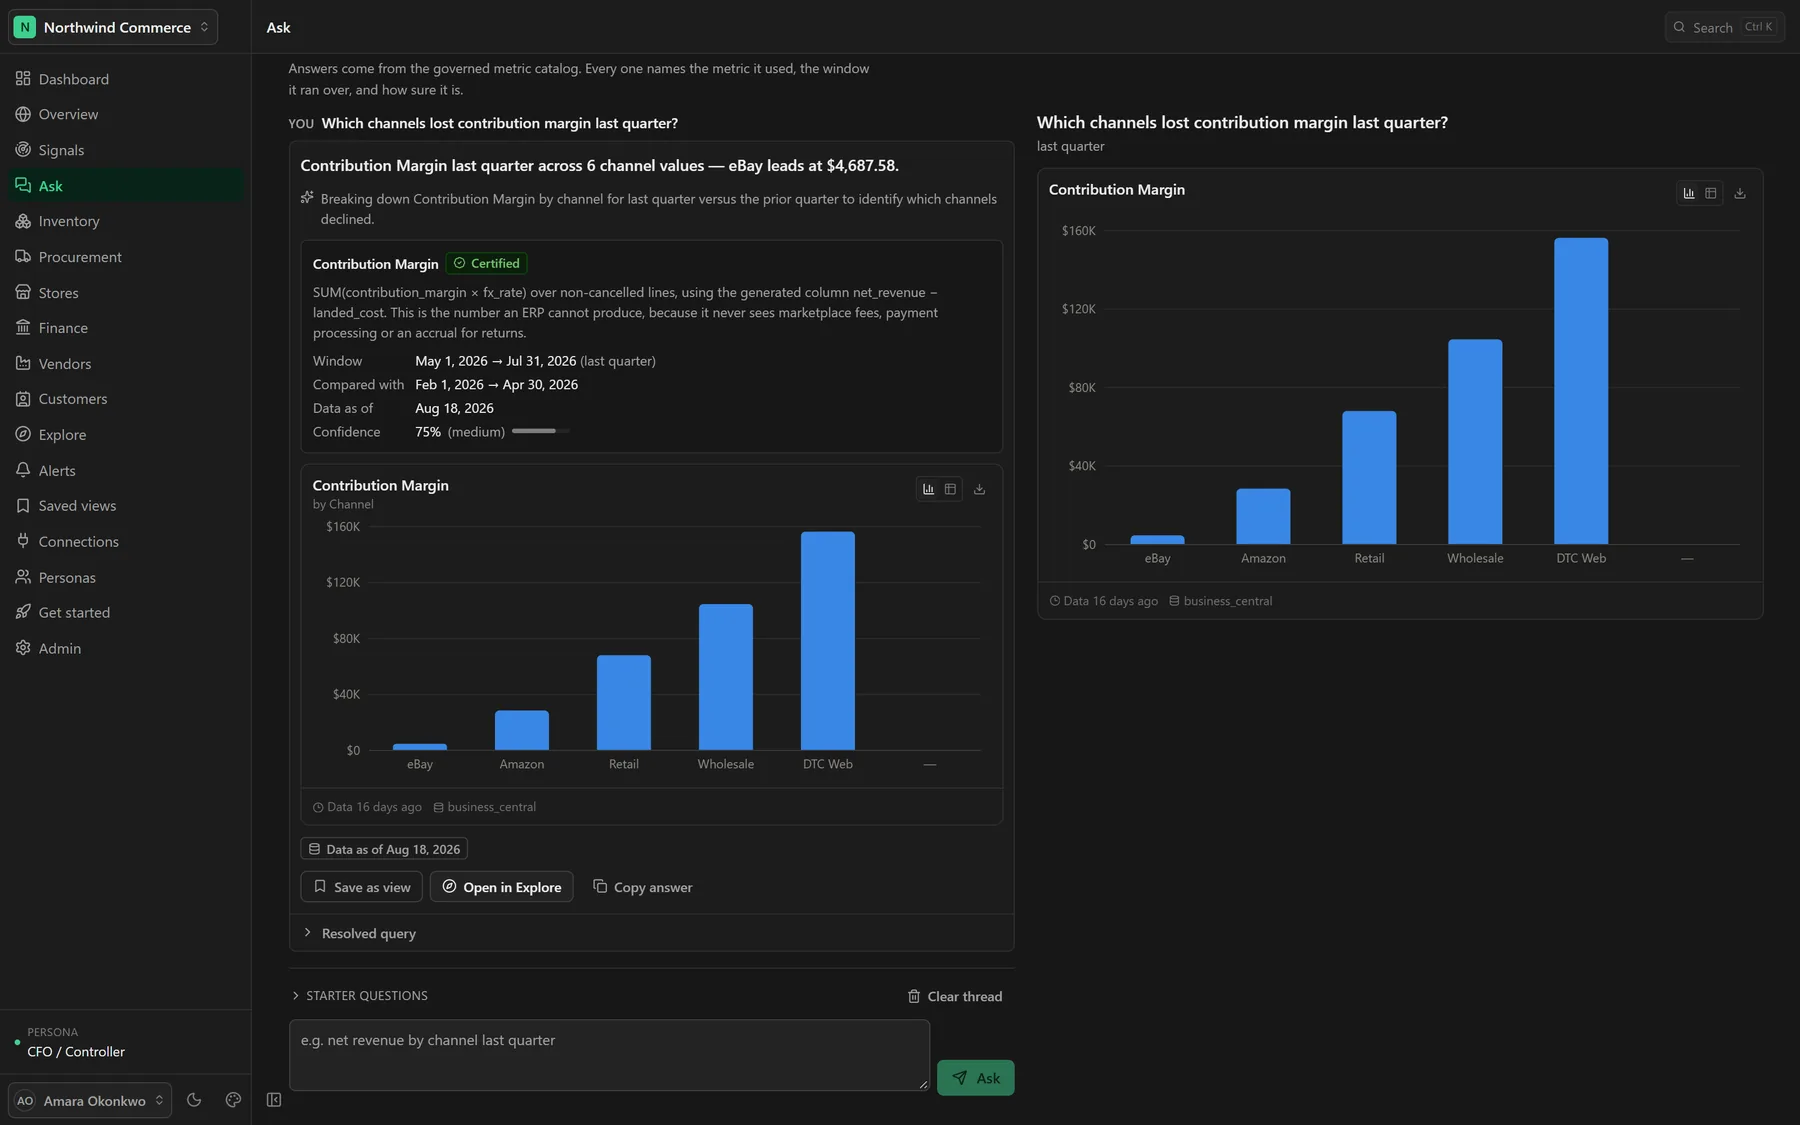
The assistant plans a query specification against the catalog — metrics and dimensions by id — which is validated and scoped before any SQL exists. It cannot invent a table, cannot widen your data scope, and cannot be injected into exfiltration, because there is no path from model output to a query string. Every answer names the metric it used, the window it ran over, when the data was last refreshed and how sure it is. Without an API key it degrades to deterministic matching over the same catalog: fewer phrasings understood, identical numbers.
QuerySpec, never SQL · 229 metrics · cited window and freshness
In the field
What you'd use it for.
01
Find out which channels, categories and SKUs actually make money once freight, fees and returns are in the number.
02
Replace the Fivetran, Snowflake, dbt and Looker stack with one application a finance lead can connect in an hour.
03
Give eleven roles their own dashboard without building eleven dashboards — or hiring an analytics engineer to maintain them.
04
Ask a question in English and get an answer that names its metric, its window, its freshness and its confidence.
05
See what needs a decision today, priced and ranked, instead of reading a dashboard and inferring it.
06
Run analytics across every legal entity, site and warehouse in a Dynamics 365 deployment without a Synapse project.
07
Know before you order: days of cover, stockout probability, and the reorder quantity for a 95% service level.
08
Catch a promotion that is destroying contribution before the quarter closes, with the break-even lift stated.
09
Give a viewer a governed stock list without giving them the keys to an ad-hoc query engine.
10
Prove tenant isolation to a security reviewer with a test that fails rather than skips when the database is unreachable.
// 02
Capabilities
What's inside.
15 MODULES
01
Dashboard
11 personas
Declarative specs
Thresholds
The role's own screen — headline metrics, what needs attention, and the sections that explain them.
Open the dashboard for your role rather than a generic one: CFO, CEO, head of e-commerce, supply chain, marketing, merchandising, customer experience, fulfilment, procurement, warehouse manager or data admin.
Read the headline row first — the four to six numbers that decide whether anything else on the page needs looking at, each with its trend and its comparison window.
Get 'needs attention' as a list of breached thresholds in plain language, with the value and the band it crossed, and click straight through to the tile that explains it.
Change the window and the location scope from the top bar, on the pages that actually honour them — a picker that would change nothing is not rendered.
02
Signals
Priced
Ranked
Show workings
What to do today, ranked by what it is worth — and every number openable down to its arithmetic.
Read four totals before anything else: money at risk if nothing changes, money already lost in the window, capital tied up doing nothing, and how many findings are rated critical.
Work a ranked list rather than a dashboard — each finding named, priced, and carrying the horizon over which the impact lands.
Expand 'show workings' on any of them: the inputs, the counterfactual the impact is measured against, and the formula. An impact whose derivation is hidden gets believed when it should not be.
See the detectors that ran and the ones that did not, with the reason — a missing input is reported, not silently treated as a clean bill of health.
Get the same briefing as a morning email, composed from the findings rather than generated over them.
03
Ask
Plans a QuerySpec
Never SQL
Cites itself
A question in English, answered from the governed catalog — with the metric, the window and the confidence on the answer.
Ask in your own words and get a number, a chart and a sentence — with the certified metric definition, the window it ran over, the comparison period, the data-as-of date and a confidence score printed beside it.
Open 'resolved query' to see exactly what was run: the metrics, the dimensions, the filters. There is no hidden SQL to take on trust, because SQL was never written.
Start from the questions your role usually asks, or ask for a whole report — 'a dashboard for cash and receivables' — and get a set of widgets you can save.
Save any answer as a view, or open it in Explore to keep pulling on it.
Run it with no model API key at all: the assistant falls back to deterministic matching over the same catalog, which understands fewer phrasings and returns identical numbers.
04
Explore
229 metrics
101 dimensions
Analyst-gated
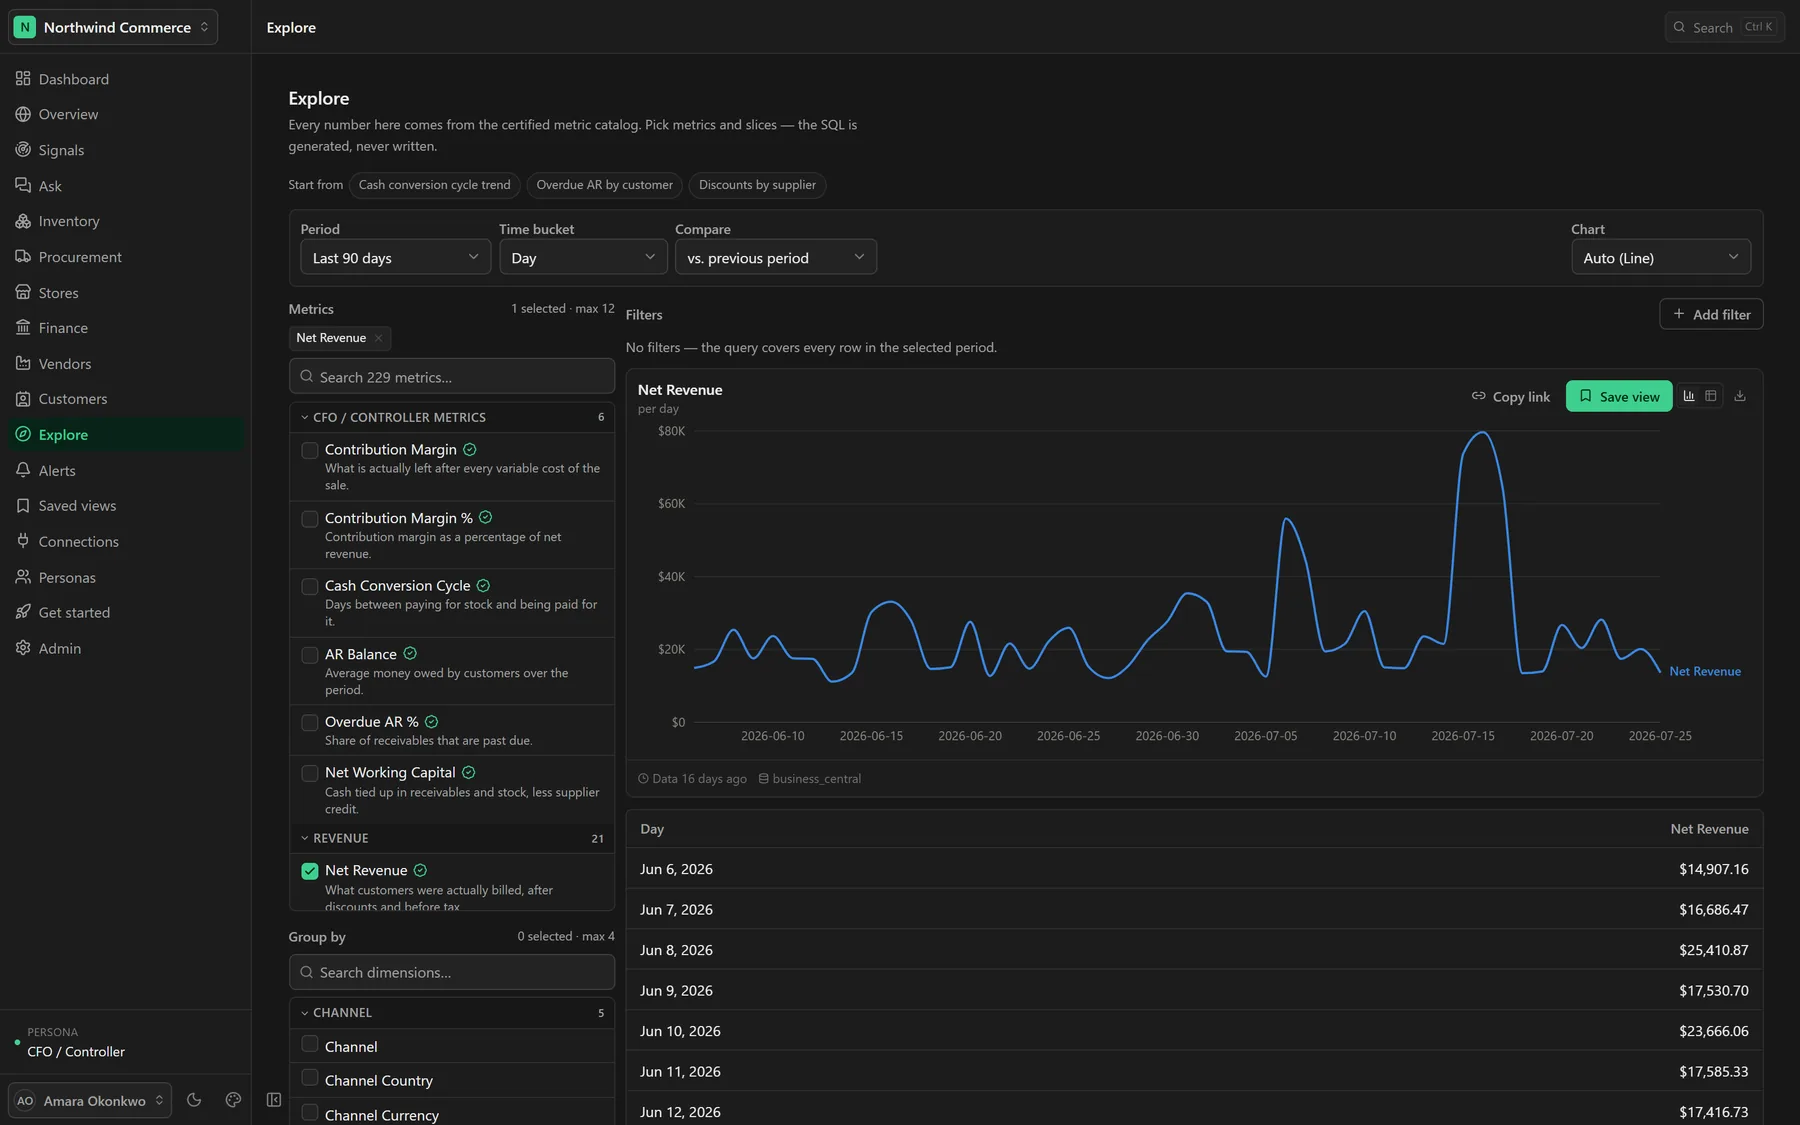
The ad-hoc workbench over the catalog — pick metrics and slices, and the SQL is generated rather than written.
Search 229 governed metrics by name, synonym or domain, each carrying its definition, its owner and whether it is certified.
Group by up to four of 101 dimensions, filter on declared columns, set the bucket and the comparison, and switch between chart and table.
Read the certification mark before you use a number: a certified metric has an owner and a settled definition; an uncertified one says so rather than looking identical.
Copy a link to the exact query, or save it as a view for the rest of the workspace.
Stay inside the governance boundary the whole time — this is a picker over the catalog, not a SQL console, and it is gated to analyst and above for that reason.
05
Overview
Cross-domain
Every role
At a glance
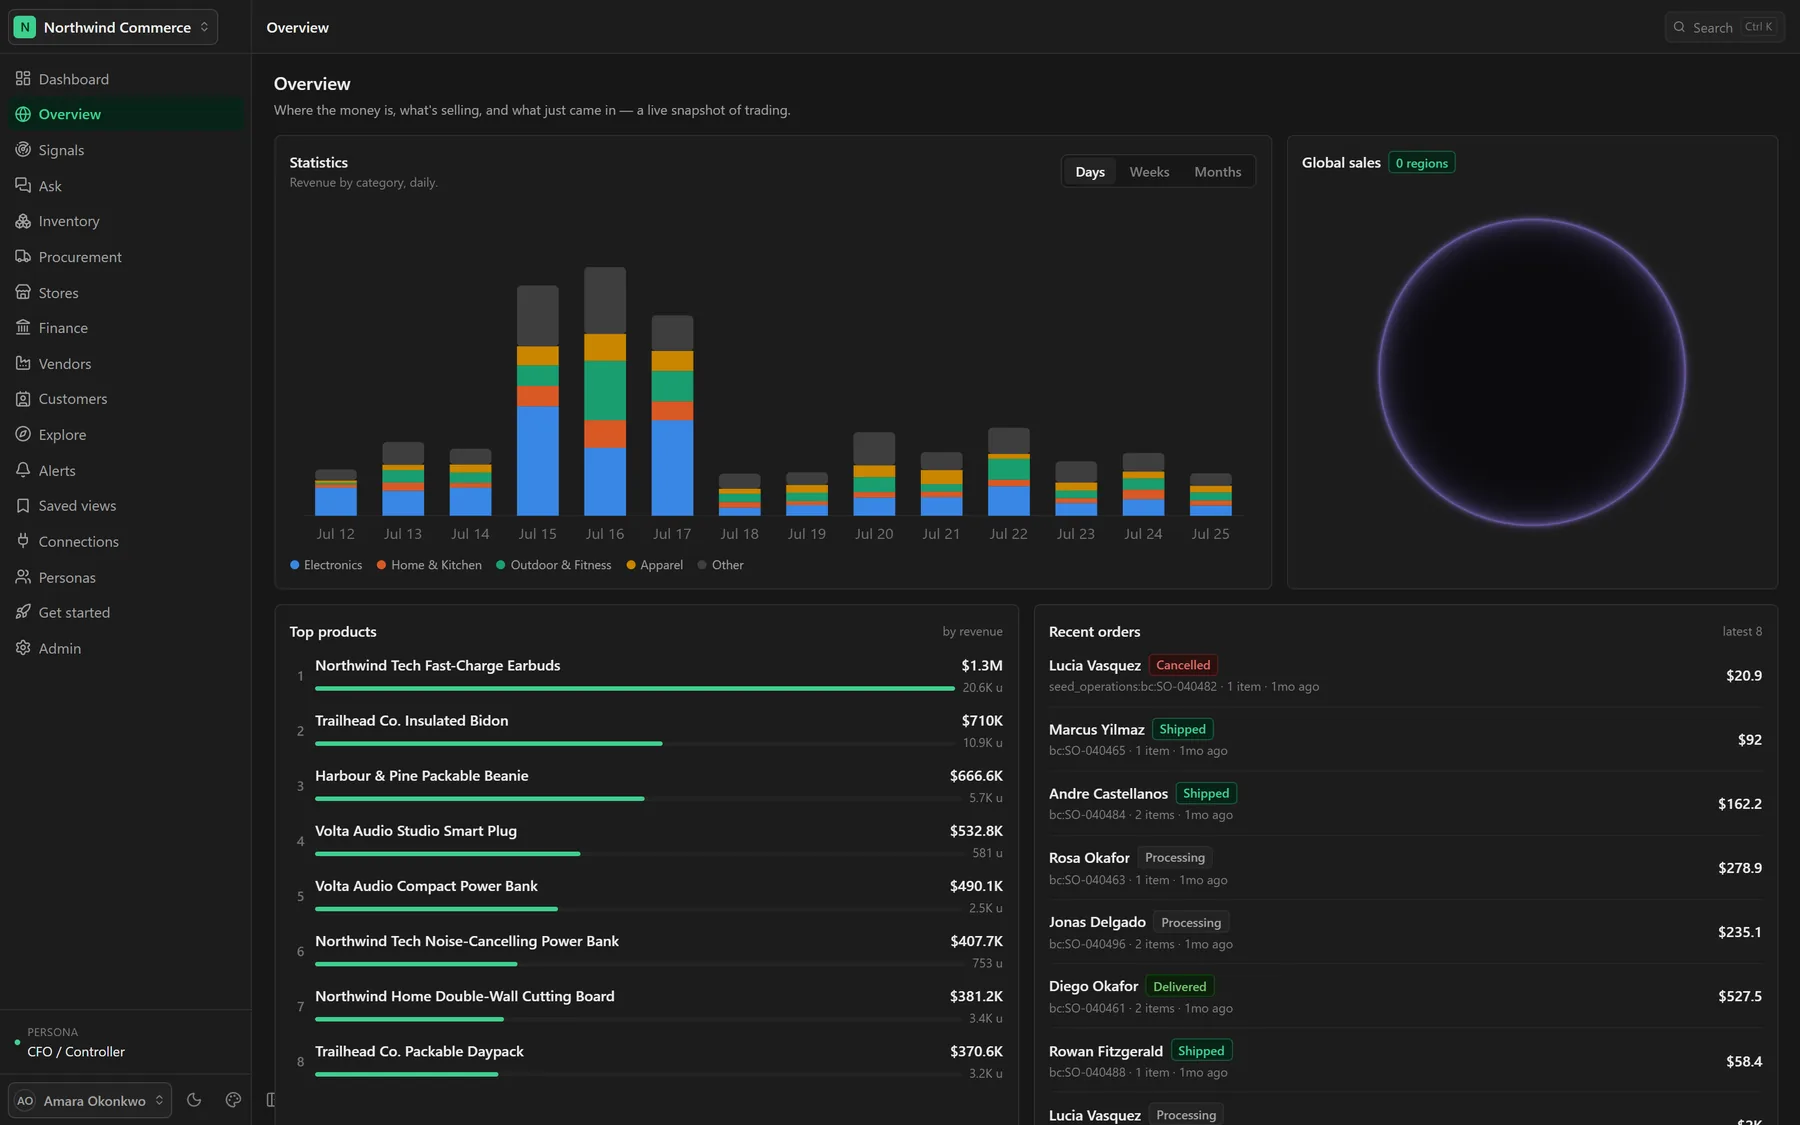
Where the money is, what is selling, and what just came in — the snapshot every role may read.
See revenue by category by day, week or month, with the mix stacked rather than merged into one line.
Read the top products by revenue with units alongside, so a high-revenue, low-volume line is distinguishable from the opposite.
Watch the most recent orders arrive with their status and their value.
Use it as the shared screen: it reads the same aggregates a viewer can already see, so it needs no extra permission.
06
Inventory
Days of cover
Dead stock
In / out ratio
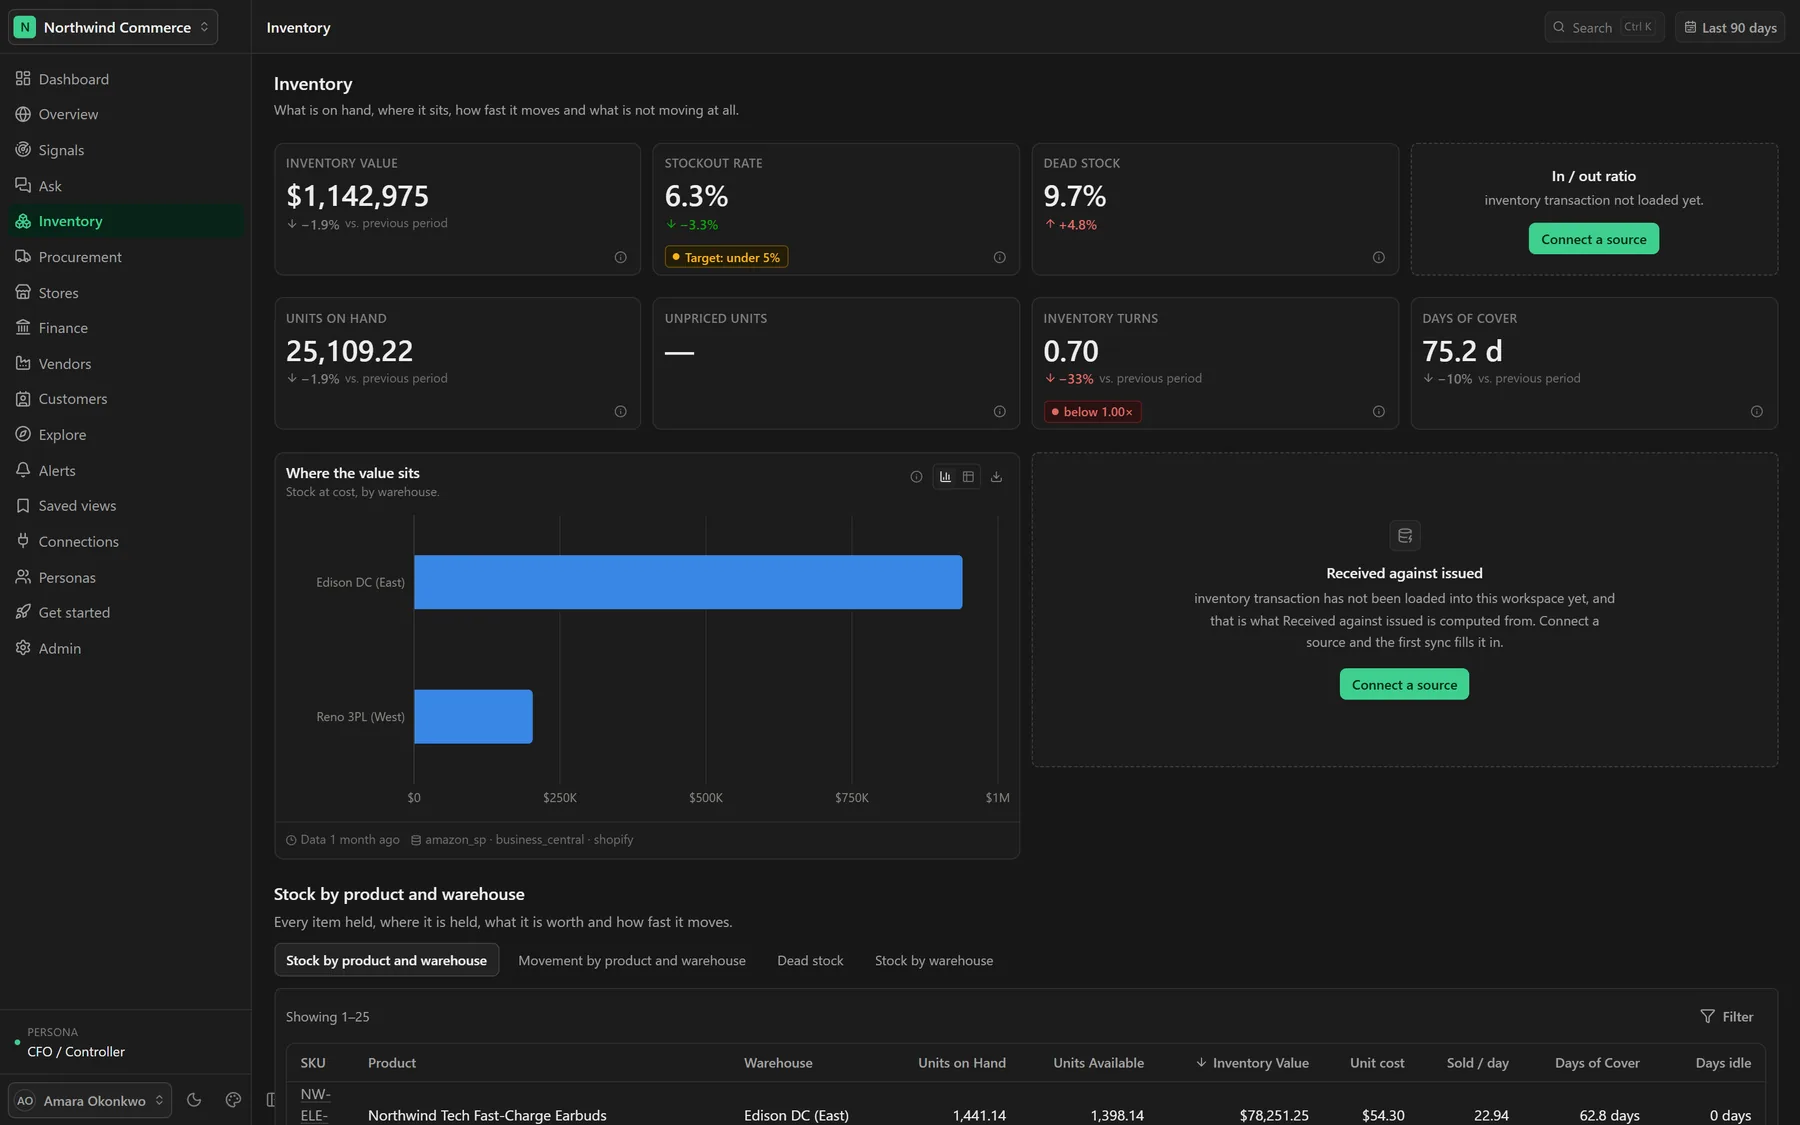
The stock position as an operator needs it — a level, a service measure, a waste measure and a direction.
Read four numbers that together say whether the position is healthy: value on hand, stockout rate, dead-stock share and the in/out ratio.
See where the value sits by warehouse and by age, and which lines have not moved inside the dead-stock window.
Work the stock list by product and warehouse — units on hand, units available, inventory value, sold per day, days of cover — as a governed report a viewer may open without ad-hoc query rights.
Get reorder points sized for a 95% service level, with the safety stock and the lead time that produced them.
Read dimensional stock on a Dynamics deployment: site, warehouse, location and inventory dimensions, rather than one flat quantity per SKU.
07
Procurement
OTIF
Lead-time variance
Concentration
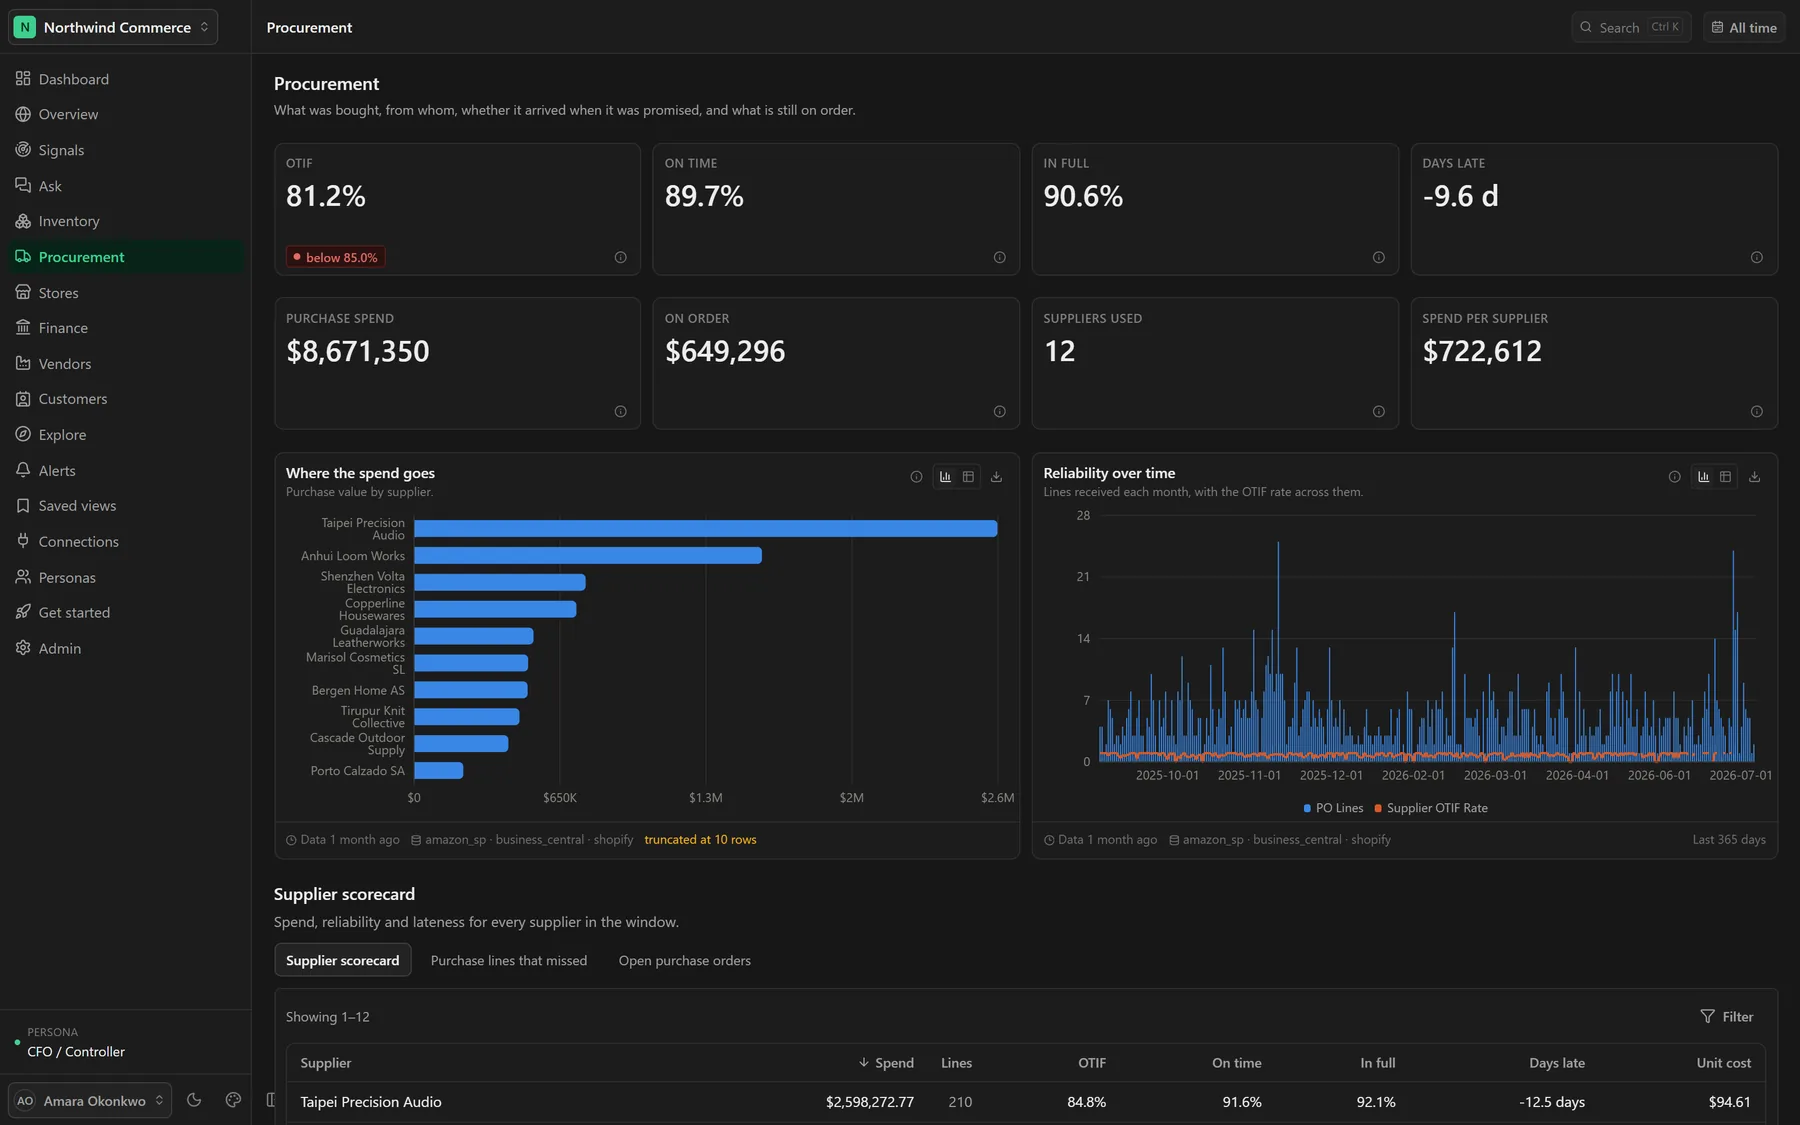
The buy side of the same warehouse — reliability first, then its components, then how badly the misses miss.
Read OTIF at the top and its two components under it: a supplier can be on time and short, or complete and late, and the fix is different.
See where the spend goes and how reliable each supplier is over the window, with lines, on-time and in-full rates side by side.
Track lead-time variance rather than average lead time — the average is what you plan to, the variance is what breaks the plan.
Watch supplier concentration, so the risk of a single failure is a number rather than an assumption.
Work over the right window: purchasing calendars are lumpy, so this page opens on all time rather than sampling one cluster of order dates and reporting an OTIF of zero.
08
Vendors & Customers
Party masters
Drill-through
Permanent way back
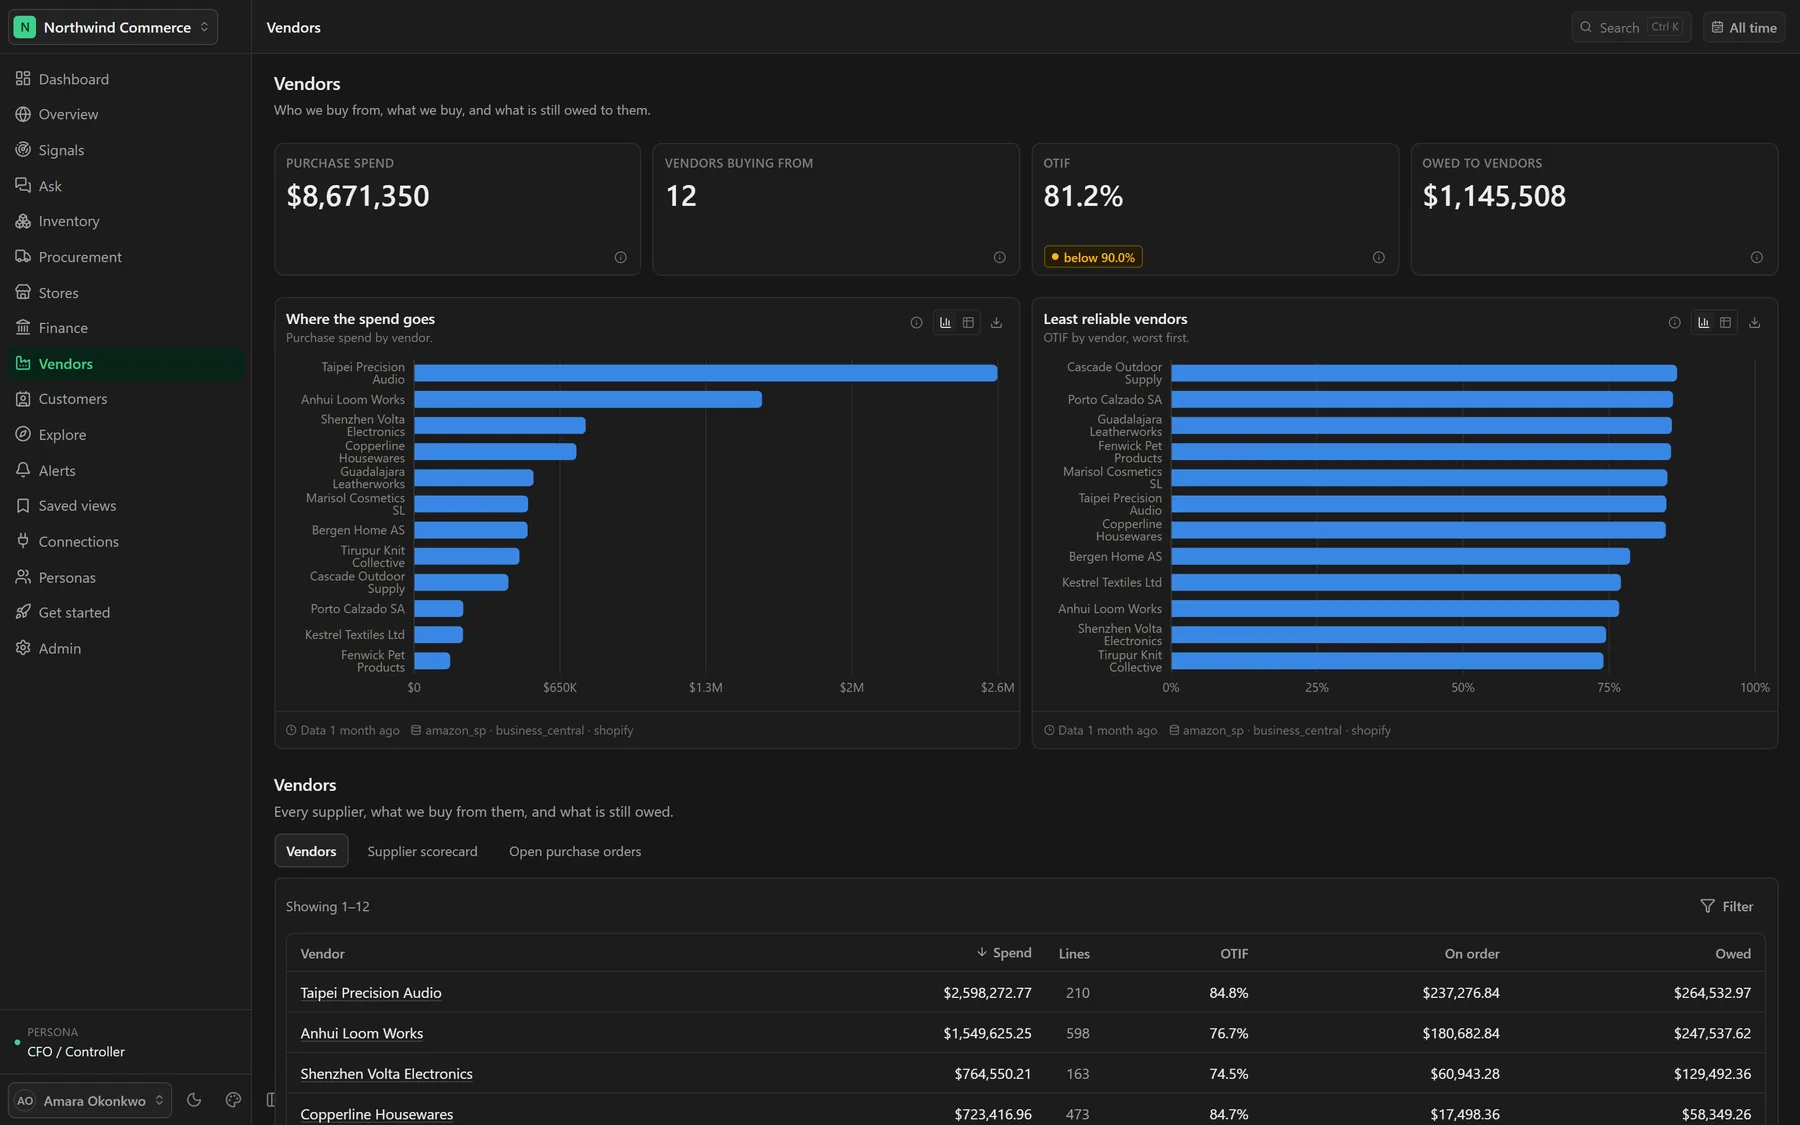
The two directories, each opening onto a single party's whole history with the business.
Arrive at a vendor from Procurement or a customer from Stores, and have a permanent page to return to rather than a filter you have to rebuild.
Read one supplier's spend, lines, OTIF, on-order and direct position together, then open their purchase orders.
Read one customer's lifetime spend, order count, average basket and days since last order — a lifetime question, so the directory opens on all time.
Segment either side and compare, without leaving the governed report path.
09
Finance & Stores
General ledger
Point of sale
Two views, one company
The ledger itself, and the till — the same business seen from the account and from the counter.
Read the general ledger over the semantic layer: revenue, expenses, net profit, net margin, total assets and liabilities, entries posted and a trial balance that has to balance.
Read the till on the Stores screen: transactions, average basket, units per transaction, sales per trading day, discount rate and return rate, by store and by day part.
Keep the distinction visible — Stores reads the till, the dashboards read the invoice, and they are different questions about the same company rather than a discrepancy to reconcile away.
Both open on all time where the calendar is lumpy, for the same reason Procurement does.
10
Alerts
Threshold
% change
Anomaly
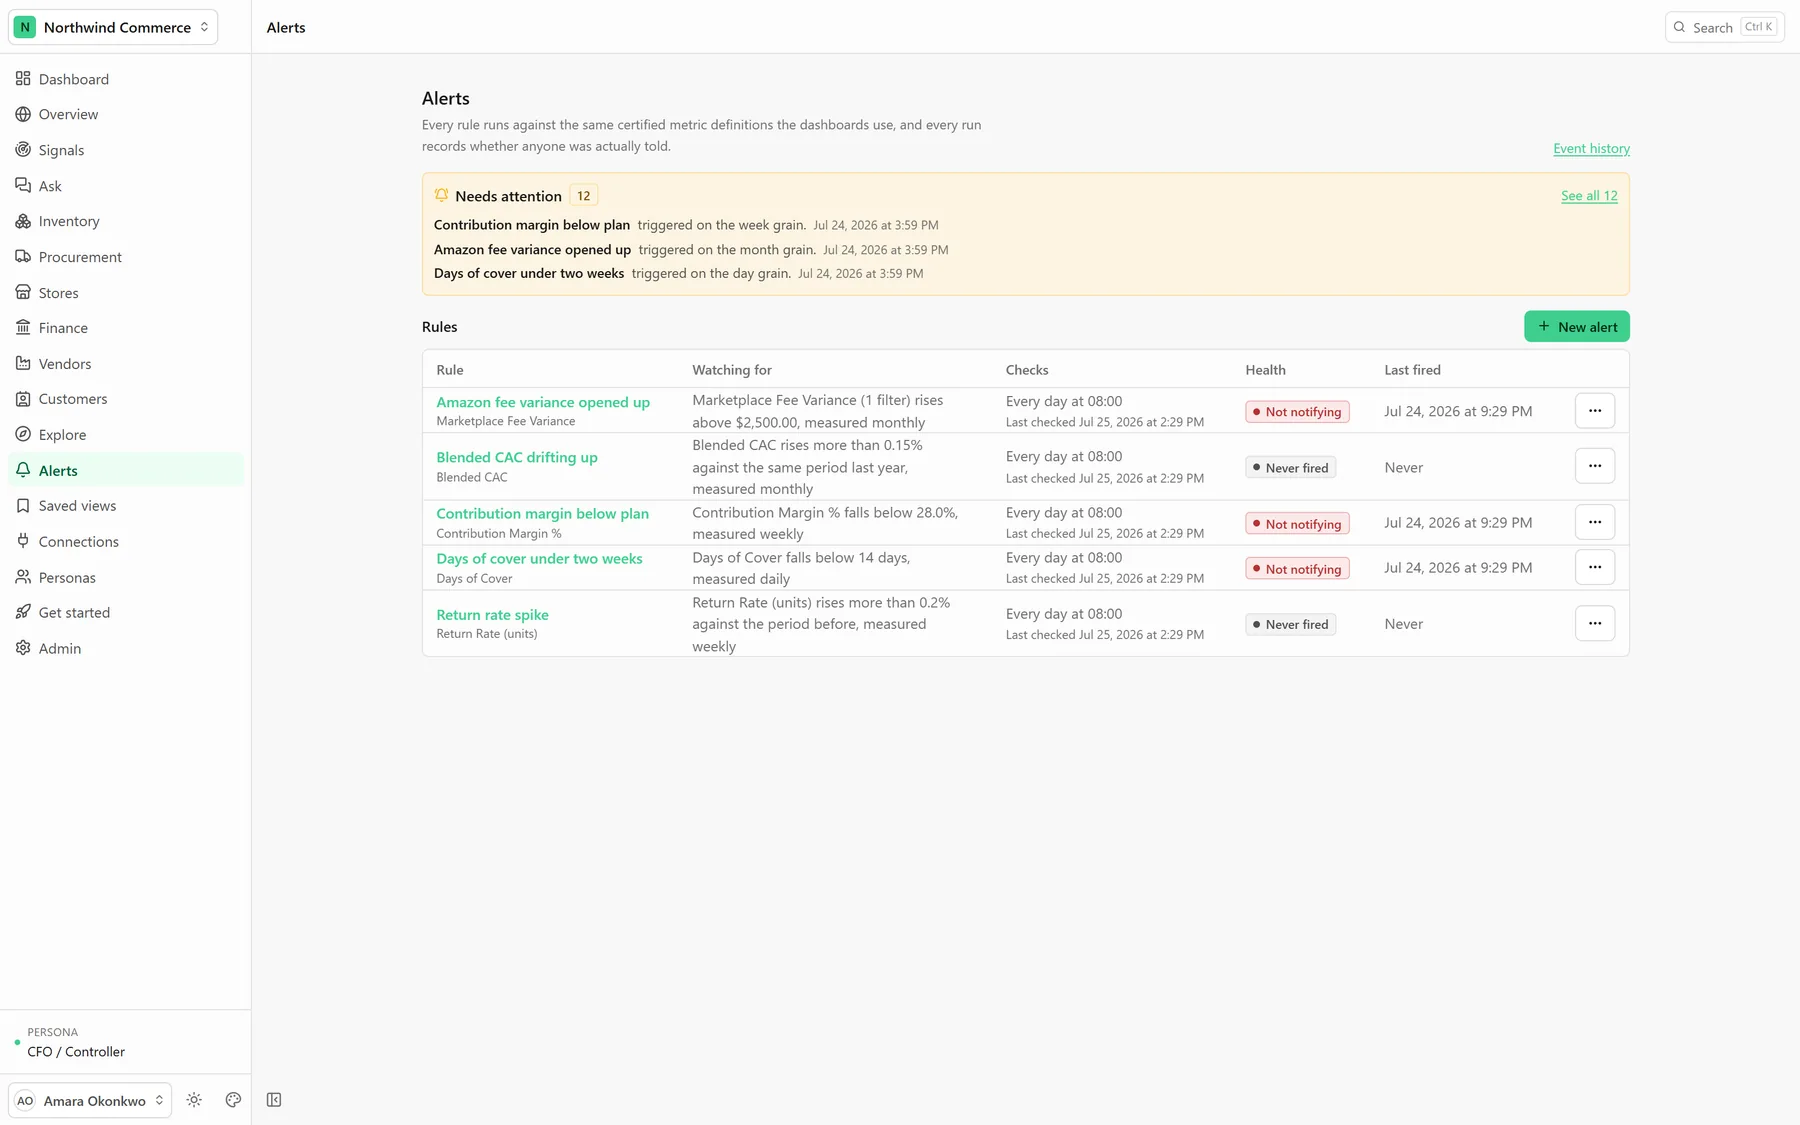
Rules that watch a governed metric and say something when it moves — evaluated the same way a dashboard is.
Write a rule against any catalog metric: an absolute threshold, a percentage change, or a statistical anomaly detected without a model.
Choose the cadence and the delivery — email or Slack — and see the last check and its result on every rule.
Read the event history: what fired, when, against which value, and what the rule was watching at the time.
Trust that an alert and a dashboard cannot disagree, because both resolve the same metric definition through the same compiler.
11
Saved views & reports
Share
Annotate
Schedule
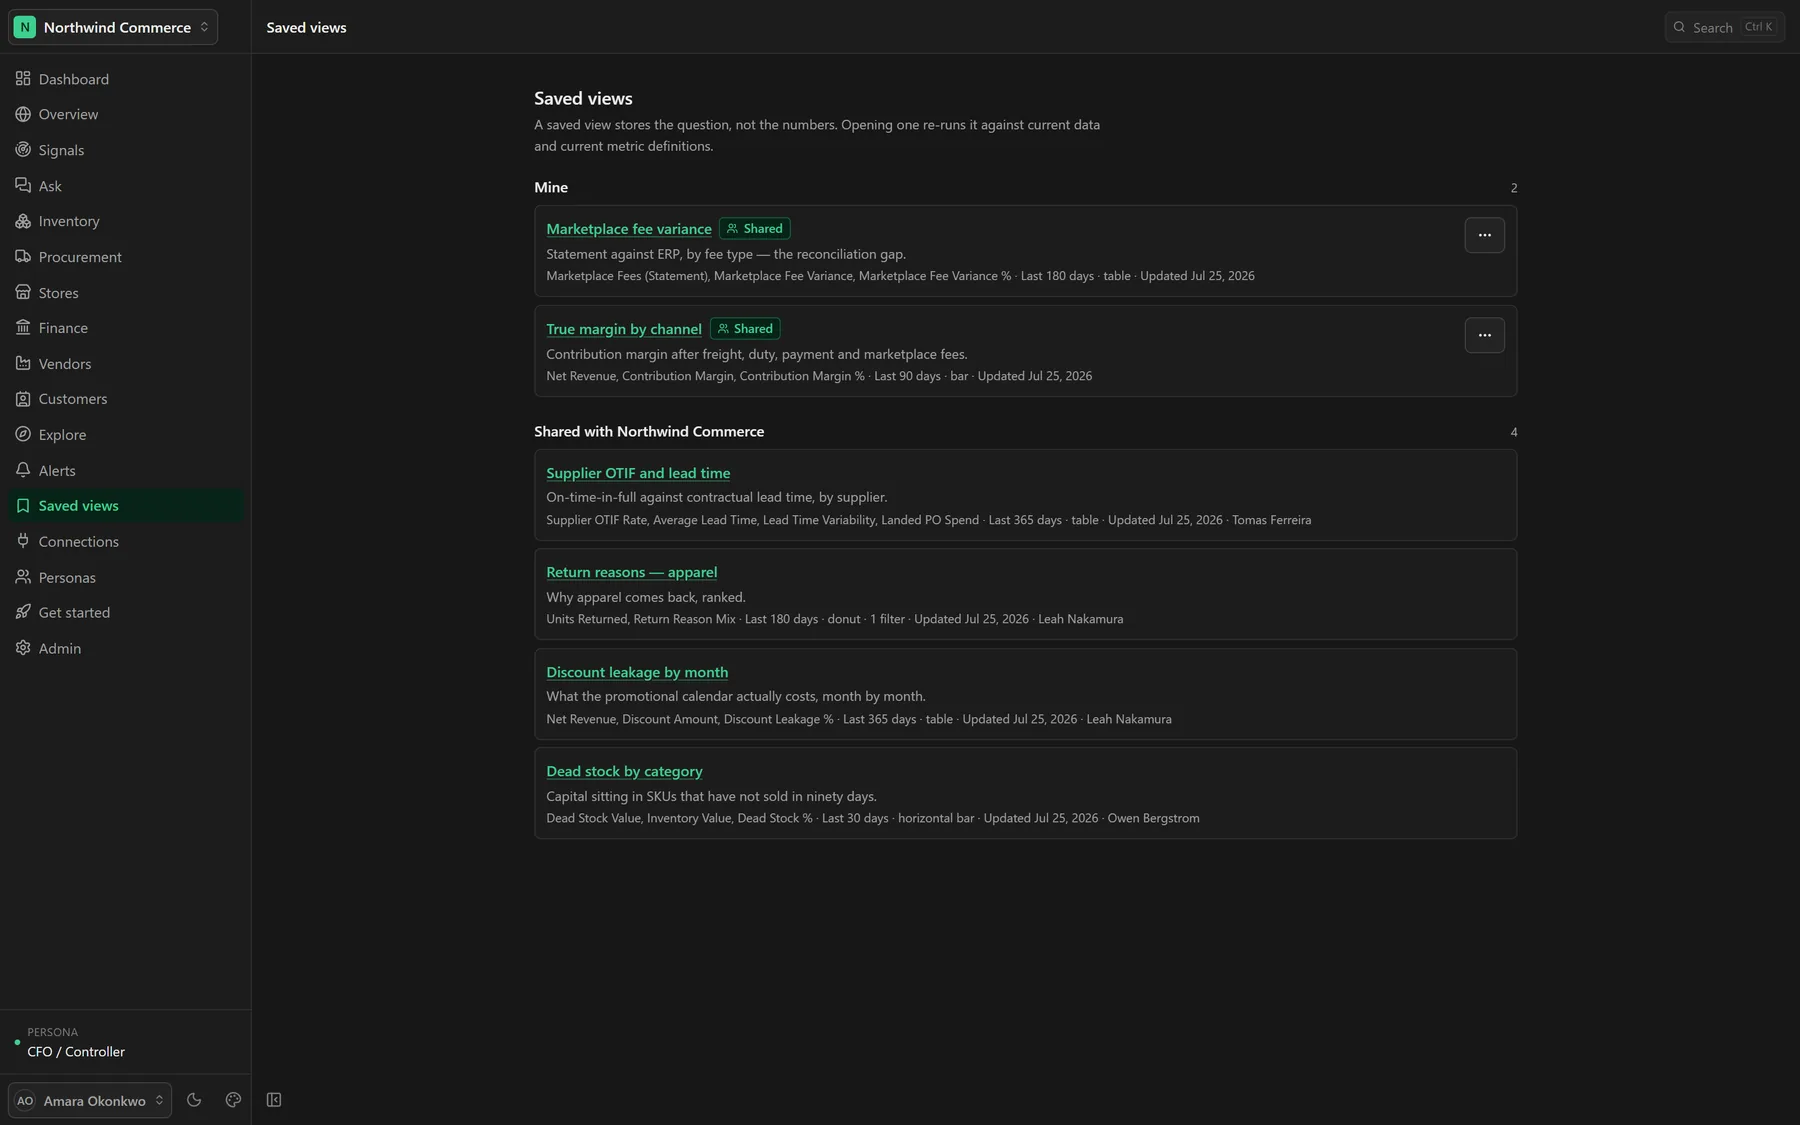
The questions worth keeping — kept, shared, annotated and posted on a schedule.
Save a query from Explore or from an answer, name it, and share it with the workspace or keep it to yourself.
Annotate a view so the next reader gets the context that made the number mean something.
Schedule an export — CSV, XLSX or PDF — to arrive without anyone opening the product.
Open a governed operational report as a paginated, sortable, filterable table, where the metrics and the fact table are fixed server-side and only page, sort and declared filters come from the browser.
12
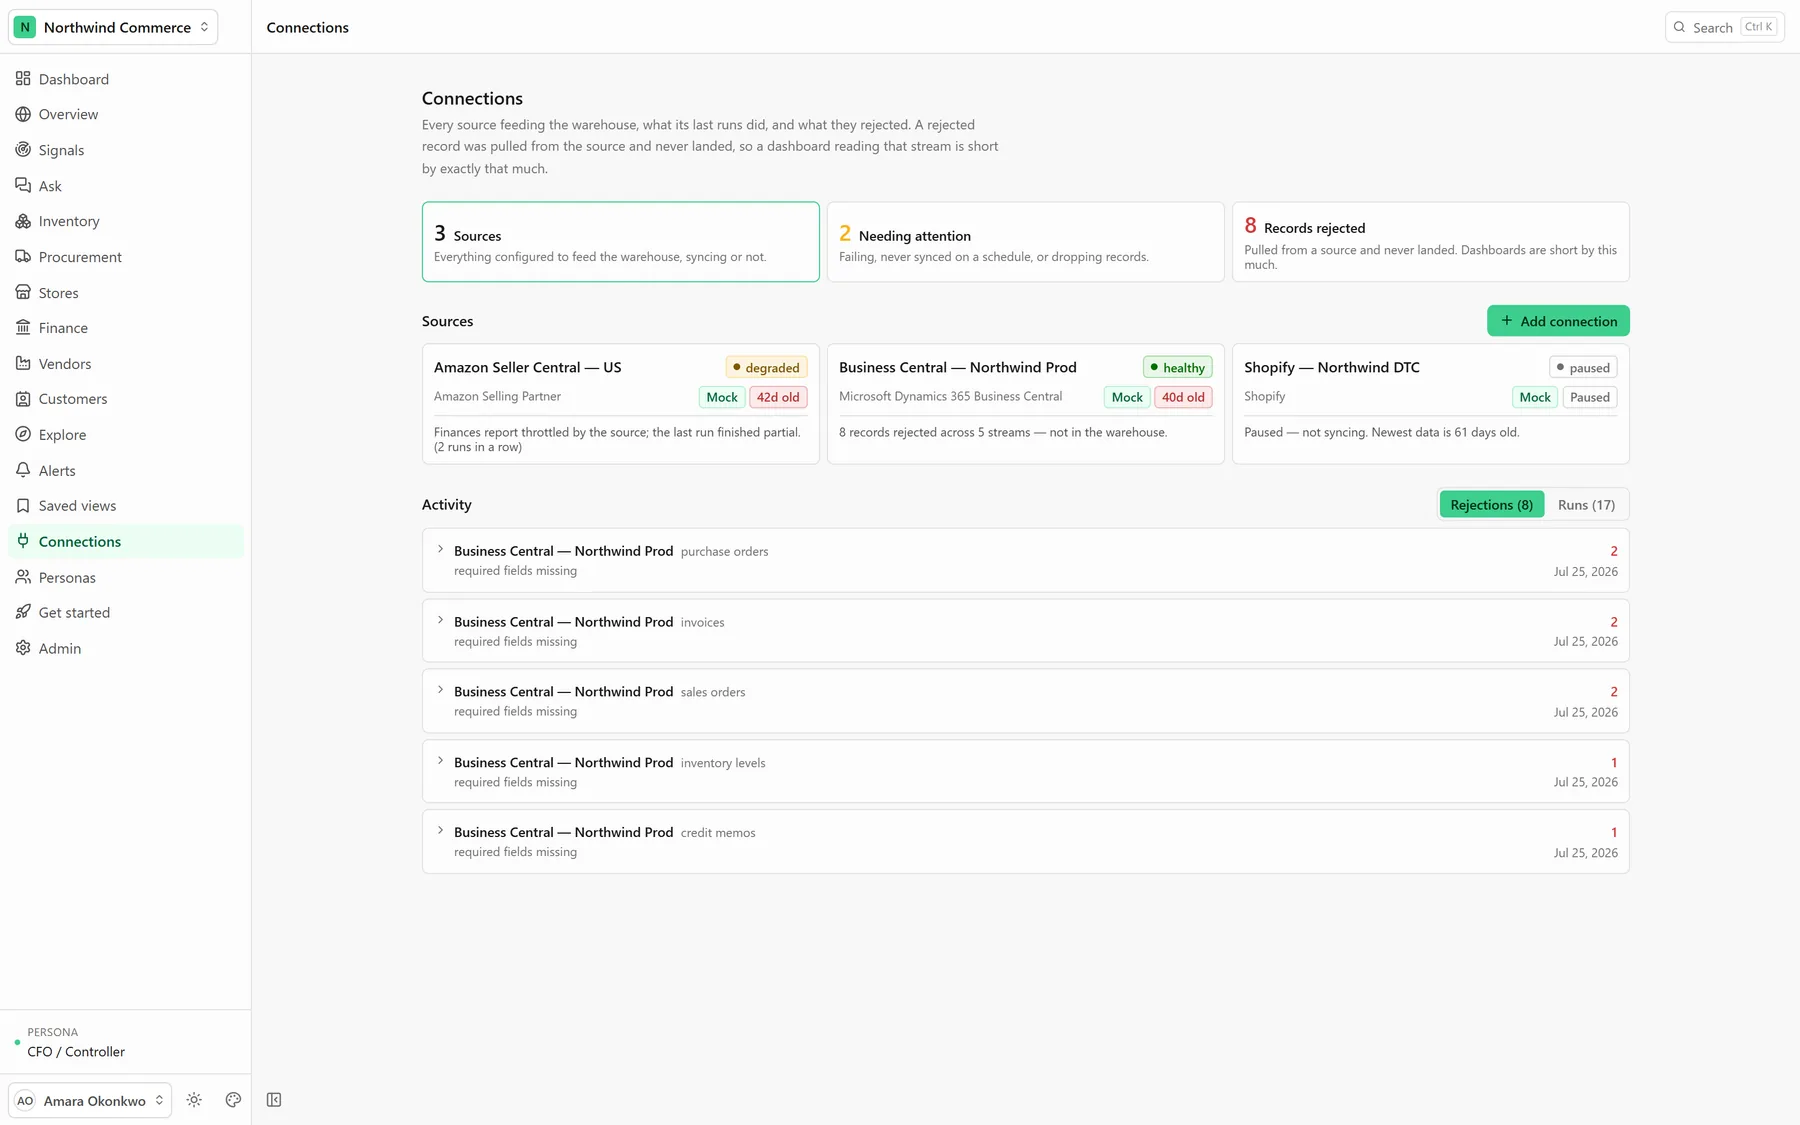
Connections
7 connectors
Watermarks
Dead-letter queue
Where the data comes from, and whether it is still arriving — with freshness stated rather than assumed.
Connect Dynamics 365 Finance & Operations, Business Central, NetSuite, Acumatica, Shopify, Amazon SP-API, or a CSV — and add the one the ERP does not hold without a code change.
Watch sync health per connection: last run, records pulled, records written, and a degraded flag after repeated failures rather than a silent stall.
Resume rather than restart — cursors are persisted after every page, and unchanged records are skipped by content hash instead of being rewritten.
Inspect and replay the dead-letter queue: an unmappable record is quarantined and surfaced, and the sync carries on.
See freshness on the tiles that depend on it, so a stale number is labelled rather than looking current.
13
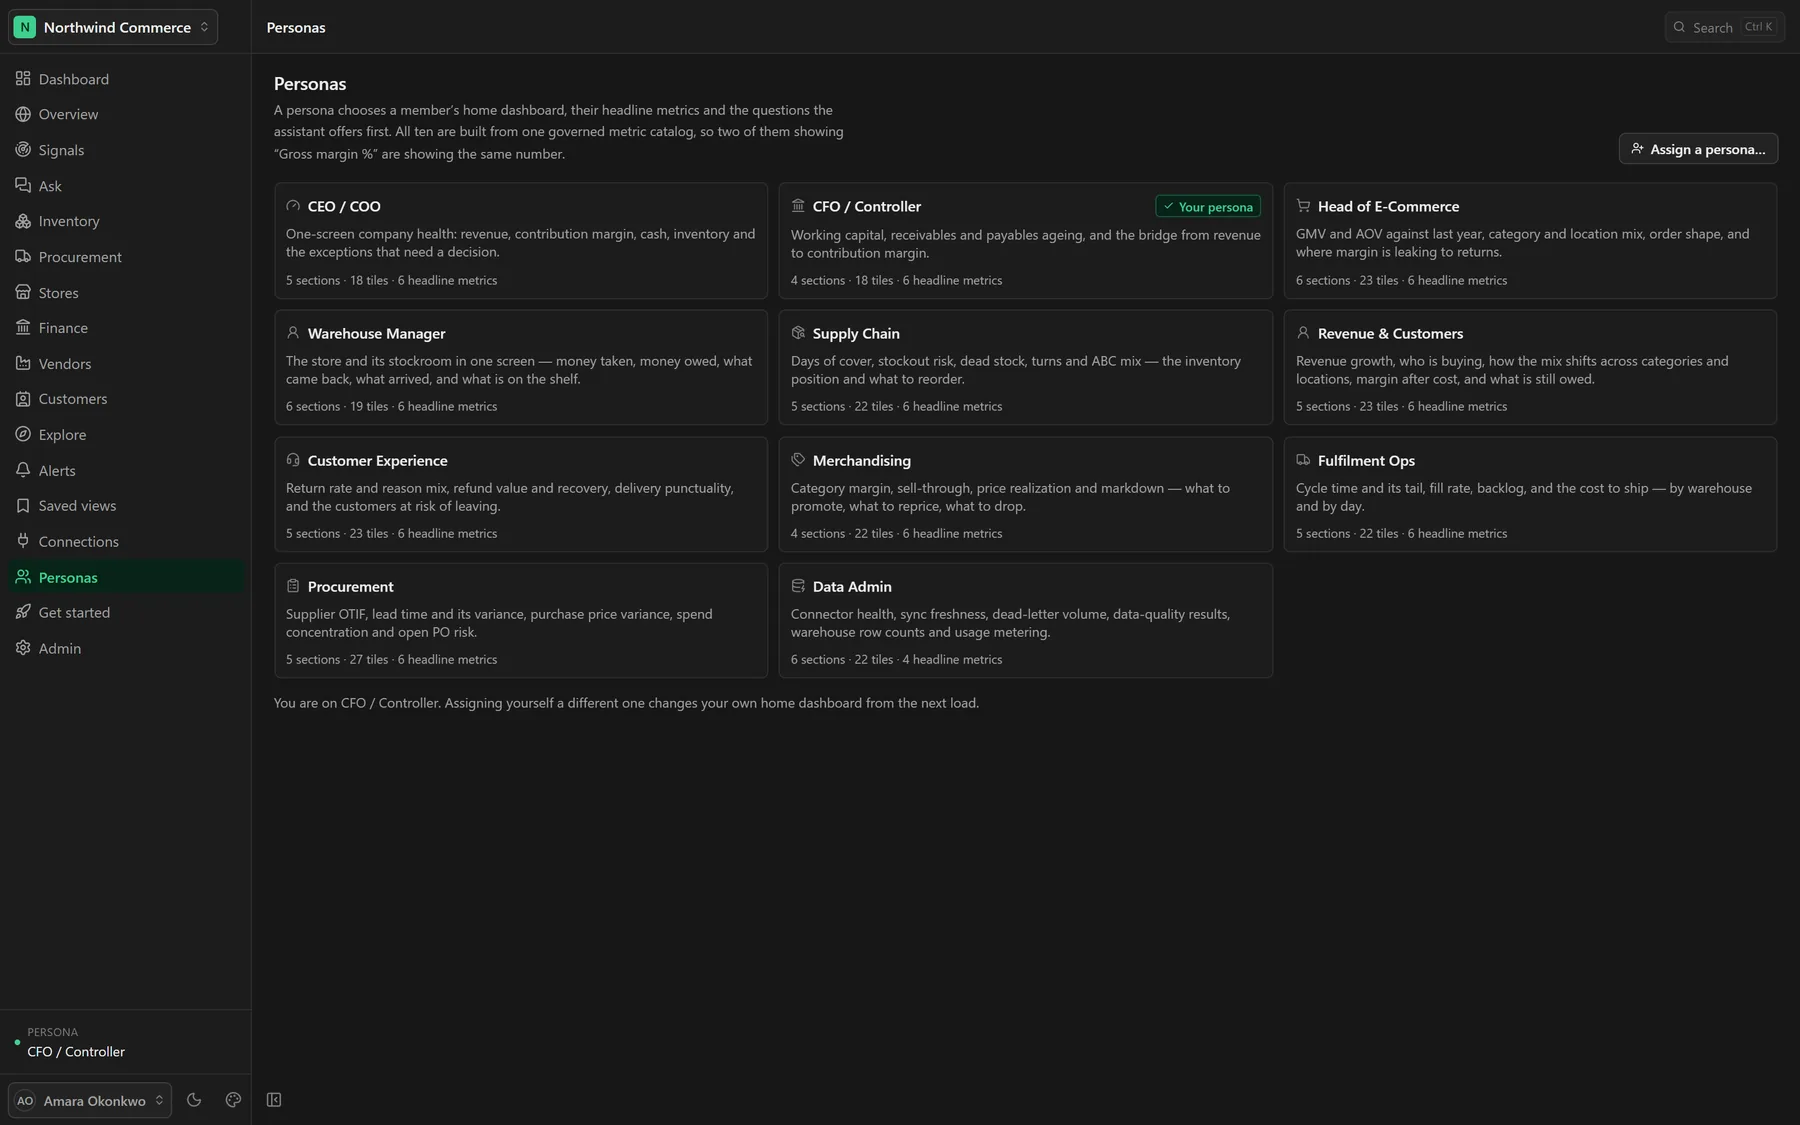
Personas
Assign
Preview
Build
Eleven role dashboards as declarative specs — assignable, previewable, and editable without touching code.
See every persona with the metrics it is graded on and the default window it opens over, and assign one to a member.
Preview a persona's dashboard as that role would see it before you hand it over.
Build on top of one: add a tile, write a formula over existing metrics from a template, and keep it inside the catalog rather than beside it.
Read what each dashboard is actually for — the question the role arrives with, not a list of charts.
14
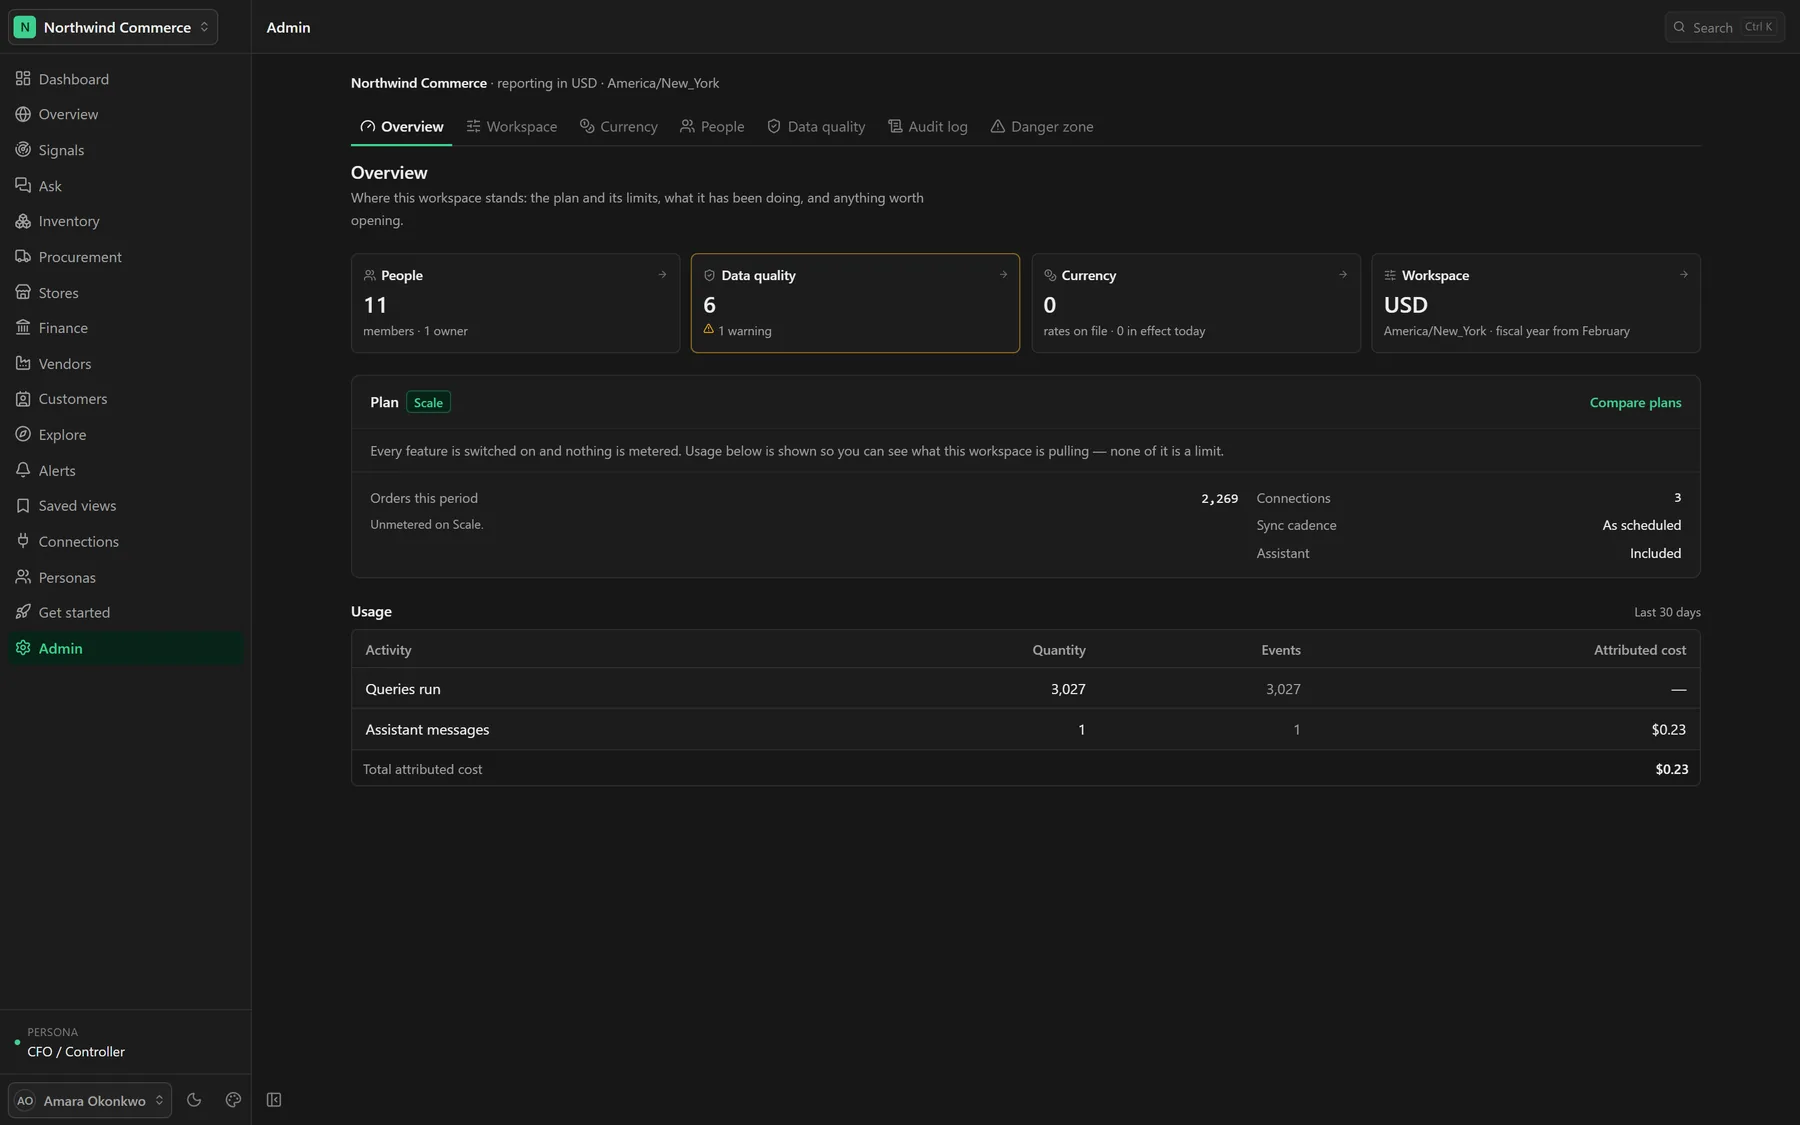
Admin & audit
RBAC
Data scope
Append-only audit
Who may see what, and an append-only record of everything anybody did.
Set roles — owner, admin, analyst, viewer — and row-level data scope on top, so a member sees only their channels or their region.
Rely on the scope being unwidenable: it is appended by the compiler after the caller's own filters, not offered as a default they can change.
Read the audit log of every mutation and every denied access, on a table the application role cannot rewrite.
Manage currency and FX, data-quality checks, people and invitations, and the workspace's plan and usage.
Rotate credentials without leaking them — the route records field names only, and redaction runs over everything on its way to a log.
15
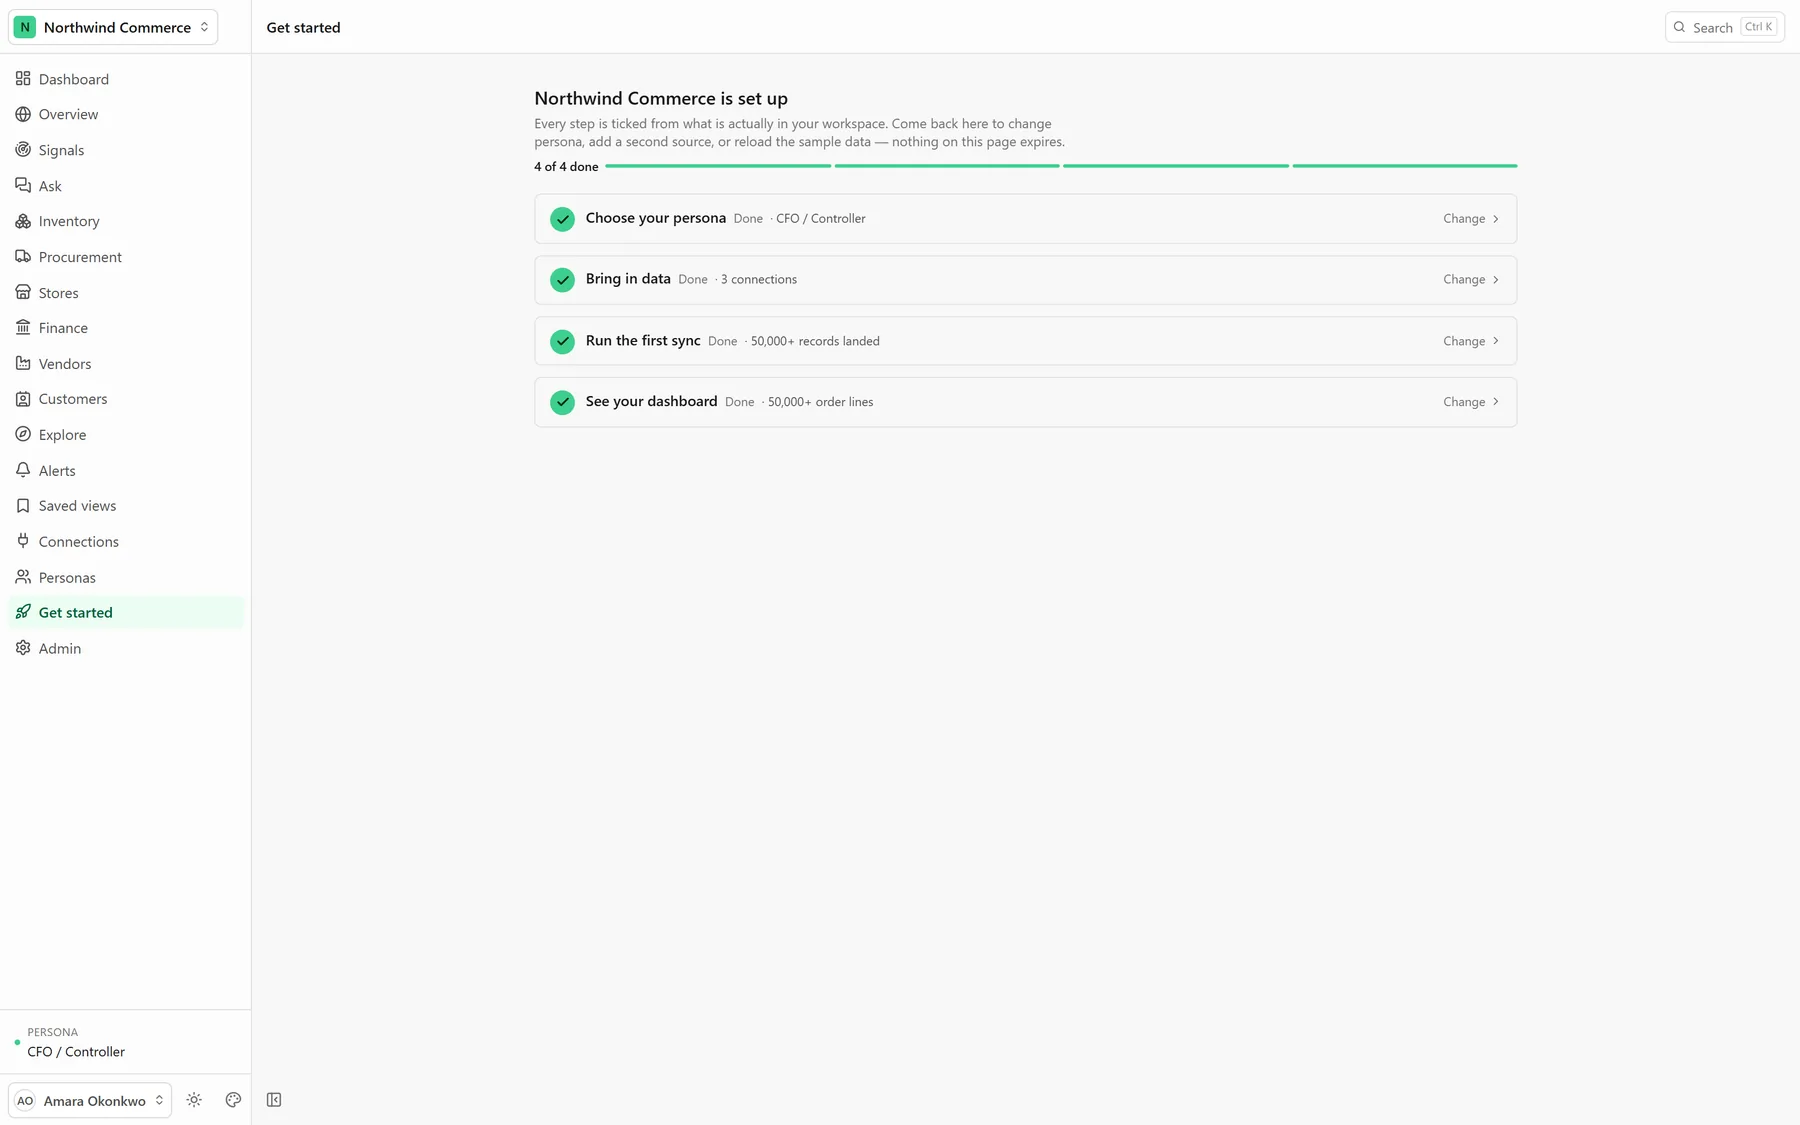
Get started
Derived from state
Not a modal
Answers the empty dashboard
A first-run checklist that stays correct months later, because it is computed from the workspace rather than dismissed.
Work four steps: choose a persona, bring in data, run the first sync, and see the dashboard.
Come back to it when a second source is added — the checklist is derived from workspace state, so it is right again rather than gone.
Get the answer to 'why is my dashboard empty' in the one place a viewer will look for it.
Explore the whole product with no ERP and no API key: every connector runs in mock mode, and a seeded workspace ships 24 months of synthetic data.
// Issued Class
Tessera Class
ERP AI is commissioned under the Tessera Class — part of the PAR2 LABS product divisions, each marked by its own issued crest.